Understanding Self-Service Business Intelligence (BI) Tools

In today’s data-driven business landscape, self-service business intelligence (BI) tools play a crucial role in enabling organizations to harness the power of data for informed decision-making. Self-service BI tools empower users at various levels within an organization to access, analyze, and visualize data without the need for extensive technical expertise.
The importance of self-service BI tools lies in their ability to democratize data and empower users to explore and gain insights from their data in a timely and efficient manner. These tools provide a user-friendly interface, allowing users to create reports, dashboards, and interactive visualizations, ultimately driving data discovery and enabling more agile and proactive decision-making.

Self-service BI refers to a set of tools and technologies that enable end-users to independently access and analyze data without relying heavily on IT or data analysts. These tools provide a user-friendly interface that allows users to query and explore data, create interactive visualizations, and generate reports and dashboards. Self-service BI tools empower users by putting the power of data analysis and insights directly into their hands, enabling them to make data-driven decisions more effectively and efficiently.
The concept of self-service BI revolves around the idea of self-sufficiency, where users can access and manipulate data without the need for technical assistance. This eliminates the traditional bottleneck of relying solely on IT or data experts for data analysis and reporting, enabling faster decision-making cycles and promoting a culture of data-driven decision-making across the organization.
Key Features to Consider in Self-Service Business Intelligence Tools

When evaluating self-service BI tools, there are several key features and capabilities to consider:
- User-friendly interface and intuitive data visualization: A self-service BI tool should have a visually appealing and intuitive interface that allows users to easily navigate and interact with data. It should offer a wide range of data visualization options, such as charts, graphs, and maps, to facilitate data exploration and analysis.
- Data connectivity and integration capabilities: Seamless integration with various data sources, databases, and file formats is essential. The tool should support both structured and unstructured data, and provide options for real-time data integration to ensure users have access to the most up-to-date information.
- Advanced analytics and reporting functionalities: Look for tools that offer advanced analytics capabilities, such as predictive analytics, machine learning, and statistical analysis. Additionally, robust reporting features, including customizable dashboards, automated report generation, and scheduling options, are important for efficient data communication.
- Collaboration and sharing options: The ability to collaborate and share insights with team members is crucial for fostering a data-driven culture. Look for tools that provide features like annotation, commenting, and sharing capabilities to facilitate collaboration and knowledge sharing among users.
- Data security and governance features: As data is a valuable asset, it’s important to ensure that self-service BI tools offer robust security measures. Look for tools that provide role-based access control, data encryption, and audit trails to protect sensitive information. Additionally, data governance features like data lineage and data quality management help maintain data integrity and reliability.
8 Best Self-Servicing Business Intelligence (BI Tools)
Tool #1: Tableau
Key Features:
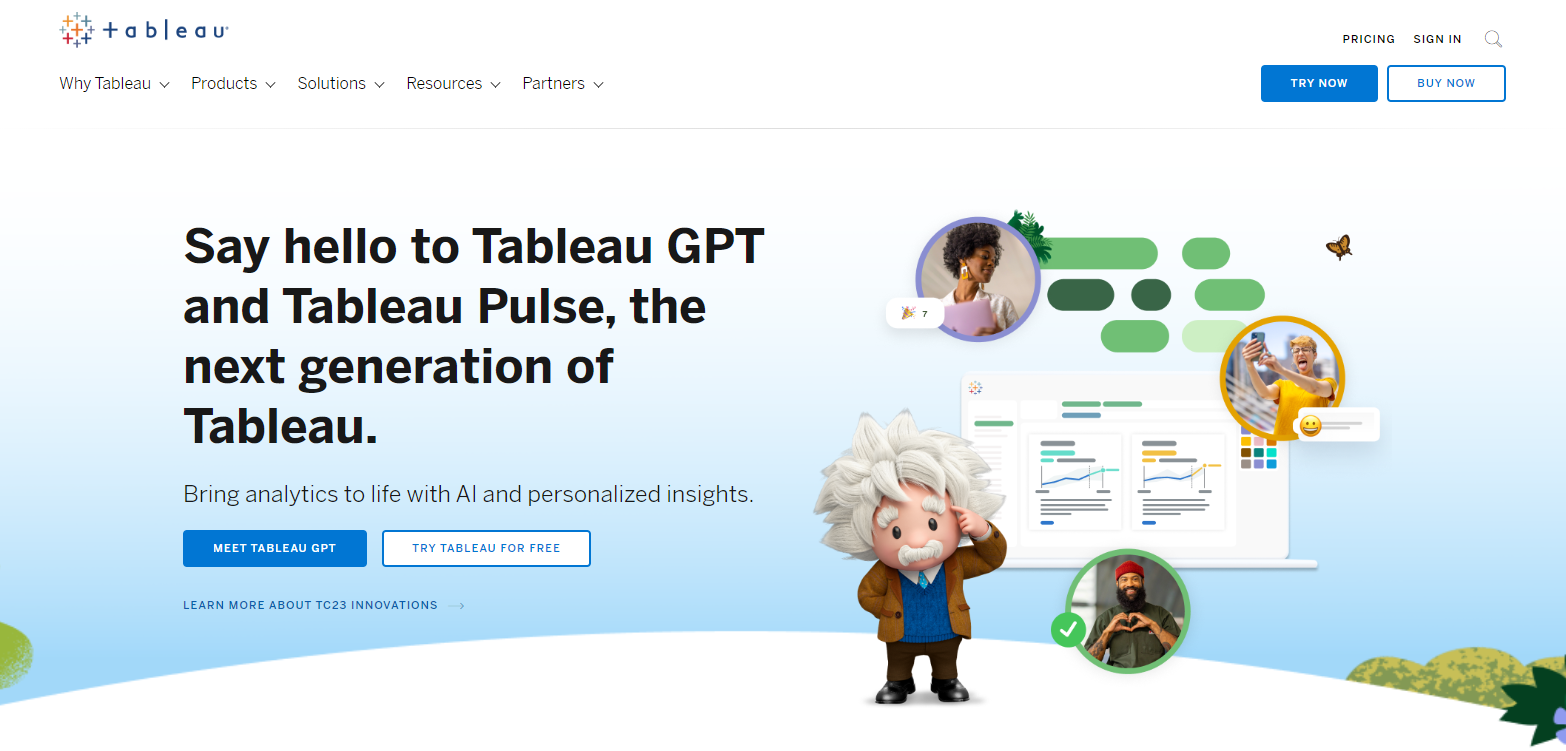
- Intuitive Data Visualization: Tableau offers a user-friendly interface with drag-and-drop functionality for creating interactive visualizations and dashboards.
- Data Connectivity: It provides seamless integration with various data sources, including databases, spreadsheets, and cloud services.
- Advanced Analytics: Tableau enables users to perform advanced analytics tasks, such as predictive modelling and statistical analysis, to gain deeper insights from their data.
- Collaboration and Sharing: Users can collaborate with others by sharing dashboards, reports, and data visualizations.
- Data Security: Tableau ensures data security through features like user-level access controls and data encryption.
Tool #2: Power BI
Key Features:
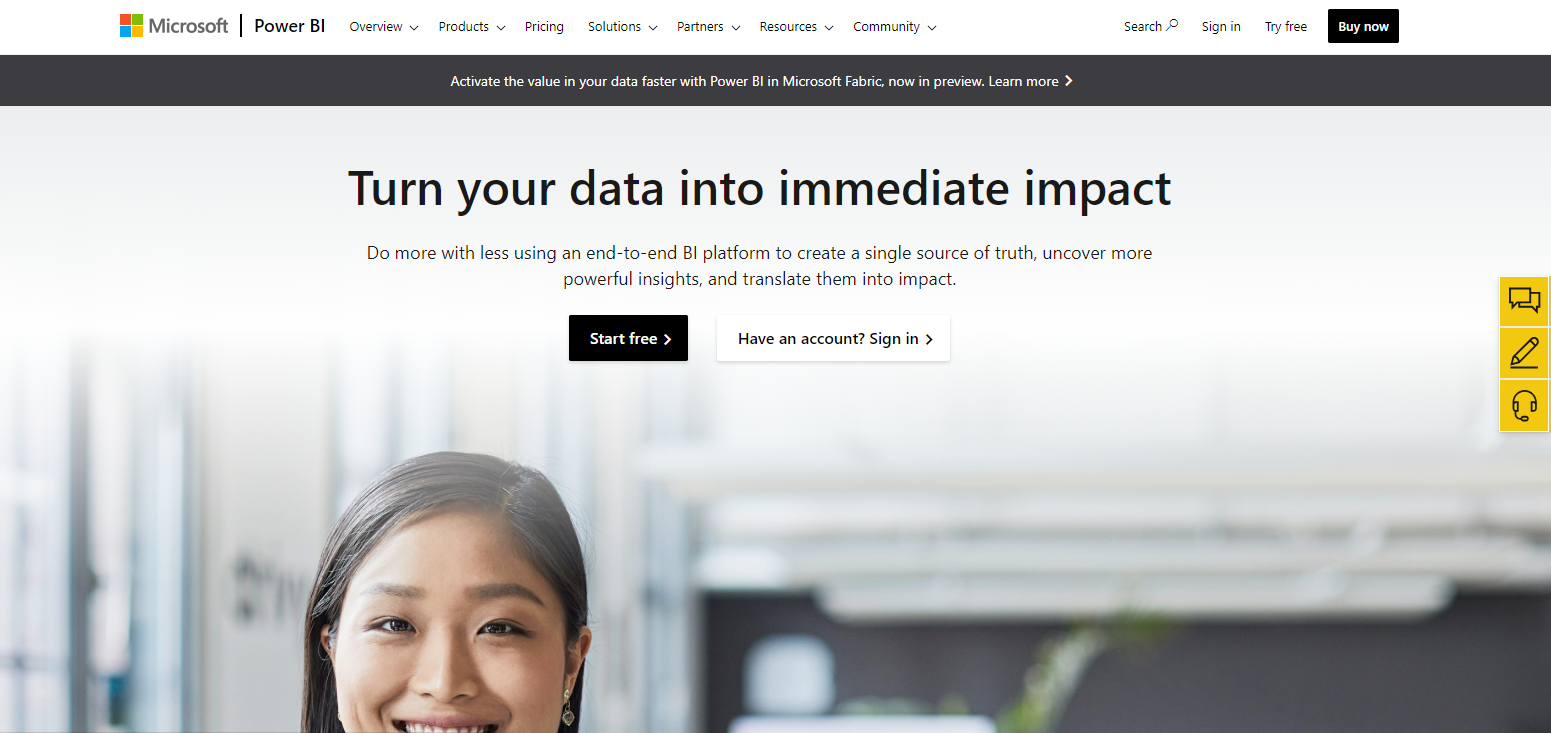
- Data Visualization: Power BI offers a wide range of interactive visualizations and customizable dashboards for effective data presentation.
- Data Integration: It seamlessly connects with various data sources, both on-premises and in the cloud, allowing users to access and analyze data from different platforms.
- Advanced Analytics: Power BI provides advanced analytics capabilities, including natural language querying and machine learning integration, for enhanced data analysis.
- Collaboration and Sharing: Users can collaborate on reports and dashboards, share insights, and publish reports for broader access within the organization.
- Mobile Support: Power BI offers a mobile app that allows users to access their dashboards and reports on the go.
Tool #3: QlikView

Key Features:
- Associative Data Model: QlikView’s unique associative data model allows users to explore data freely, making it easy to discover new insights and relationships.
- Interactive Dashboards: It provides interactive dashboards with drag-and-drop capabilities for creating visually appealing and intuitive data visualizations.
- Data Integration: QlikView supports data integration from multiple sources, enabling users to combine and analyze data from different platforms.
- Collaboration and Sharing: Users can collaborate on dashboards and reports, share insights, and distribute reports to stakeholders.
- Self-Service Data Discovery: QlikView empowers users to perform self-service data exploration and analysis without the need for extensive IT involvement.
Tool #4: Looker
Key Features:
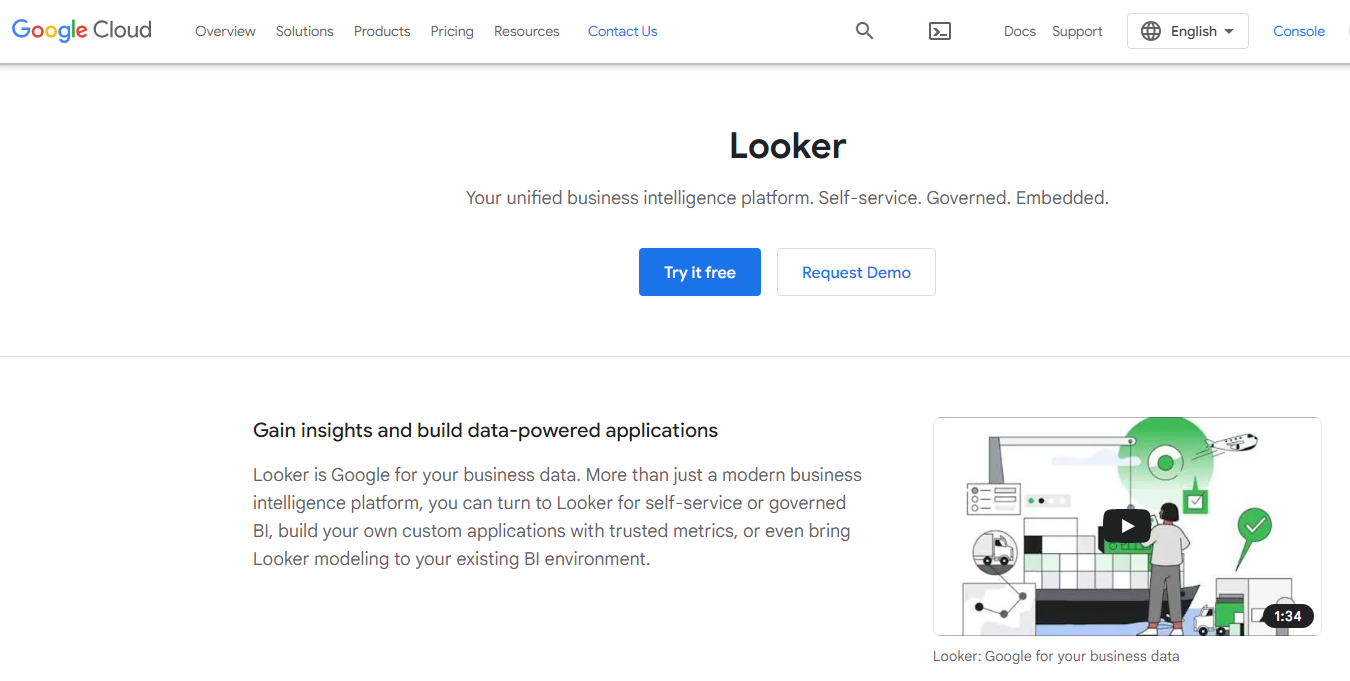
- Data Exploration and Modeling: Looker offers a powerful data exploration and modeling environment for users to navigate and analyze complex datasets.
- Customizable Dashboards: It provides customizable dashboards and data visualizations that can be tailored to meet specific business requirements.
- Data Integration: Looker seamlessly integrates with various data sources, including databases, data warehouses, and cloud platforms.
- Collaboration and Sharing: Users can collaborate with others by sharing data models, reports, and insights, fostering collaboration within the organization.
- Embedded Analytics: Looker allows for the embedding of analytics within other applications, enabling users to access insights directly within their workflow.
Tool #5: Domo
Key Features:
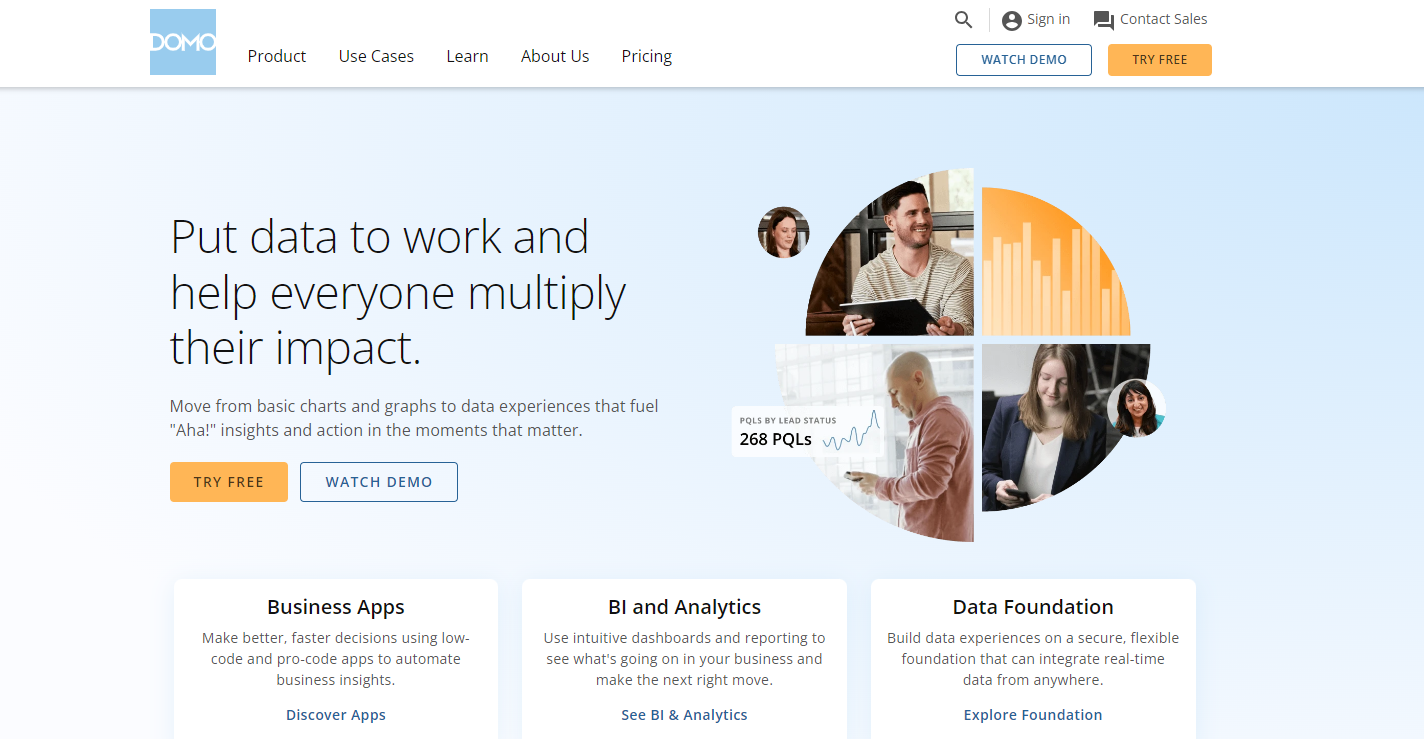
- Real-Time Data Updates: Domo offers real-time data updates, ensuring that users always have access to the most up-to-date information.
- Interactive Dashboards: It provides interactive and customizable dashboards with real-time visualizations and drill-down capabilities.
- Data Integration: Domo integrates with a wide range of data sources, enabling users to connect and analyze data from multiple platforms.
- Collaboration and Sharing: Users can collaborate on data analysis, share insights, and create data-driven stories for better communication.
- Mobile Support: Domo offers mobile apps that allow users to access their dashboards and reports on smartphones and tablets.
Tool #6: Sisense
Key Features:
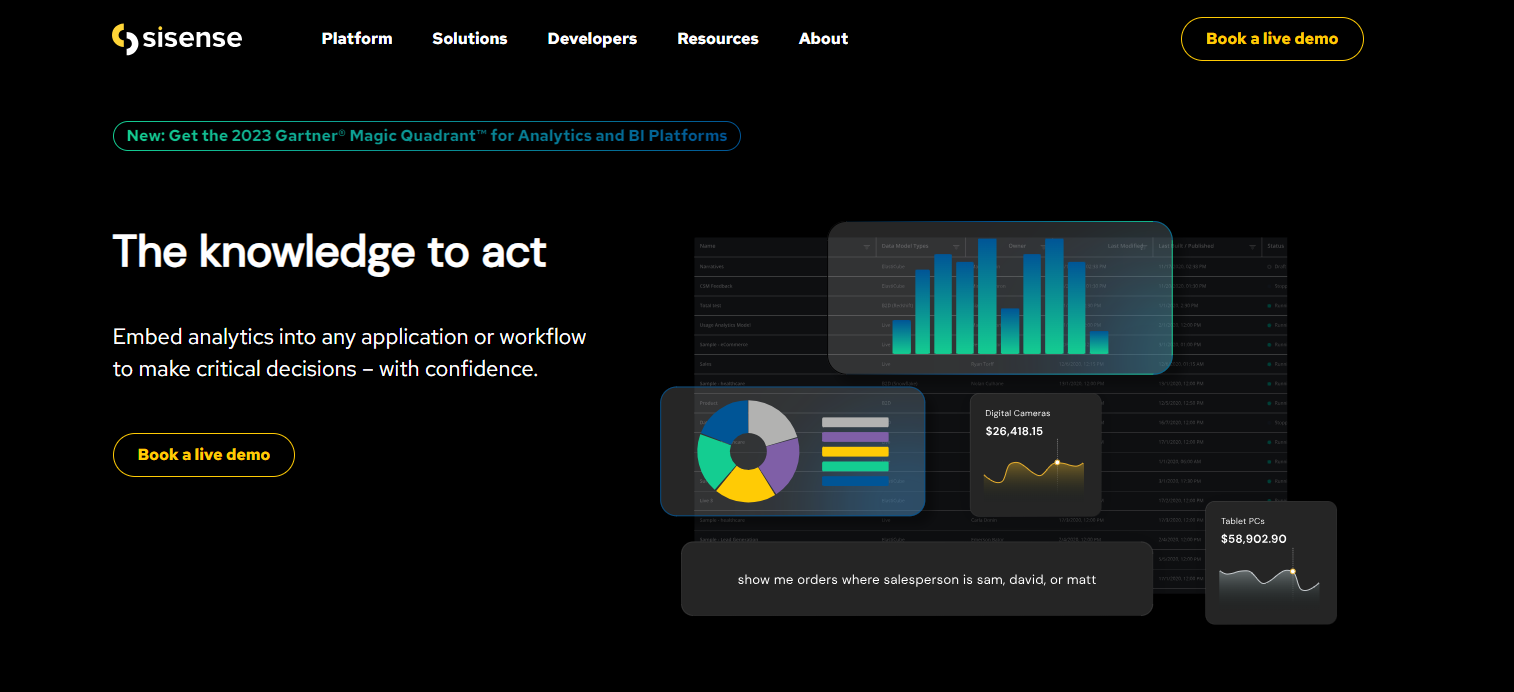
- Elasticube Technology: Sisense’s Elasticube technology allows for the efficient processing and analysis of large datasets, ensuring fast and responsive performance.
- Advanced-Data Visualization: It provides advanced data visualization options, including interactive charts, graphs, and geospatial mapping.
- Data Connectors: Sisense offers a wide range of data connectors, enabling users to connect and analyze data from various sources without complex data transformations.
- Embedded Analytics: Users can embed Sisense dashboards and analytics capabilities within other applications and portals.
- Collaboration and Sharing: Sisense allows for easy collaboration and sharing of dashboards, reports, and insights within the organization.
Tool #7: Yellowfin
Key Features:
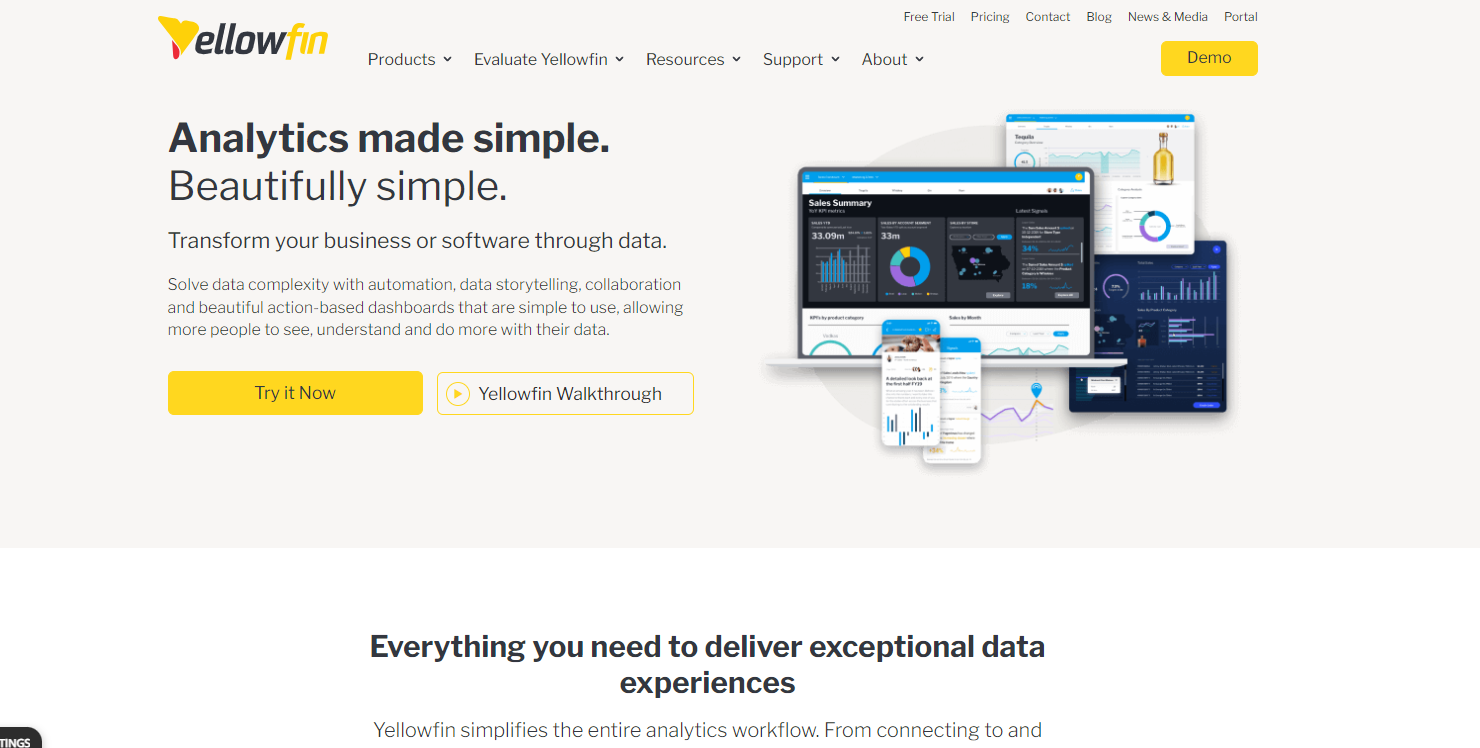
- Collaborative BI: Yellowfin provides collaborative features that enable users to discuss and annotate data, fostering collaboration and knowledge sharing.
- Storytelling and Data Narratives: It offers storytelling capabilities that allow users to create compelling data narratives and presentations.
- Data Exploration and Discovery: Yellowfin enables users to explore data through interactive dashboards, visualizations, and guided analytics.
- Mobile BI: It provides a mobile app for accessing and analyzing data on smartphones and tablets.
- Embedded Analytics: Yellowfin allows for the embedding of analytics within other applications and portals, extending the reach of data insights.
Tool #8: MicroStrategy
Key Features:
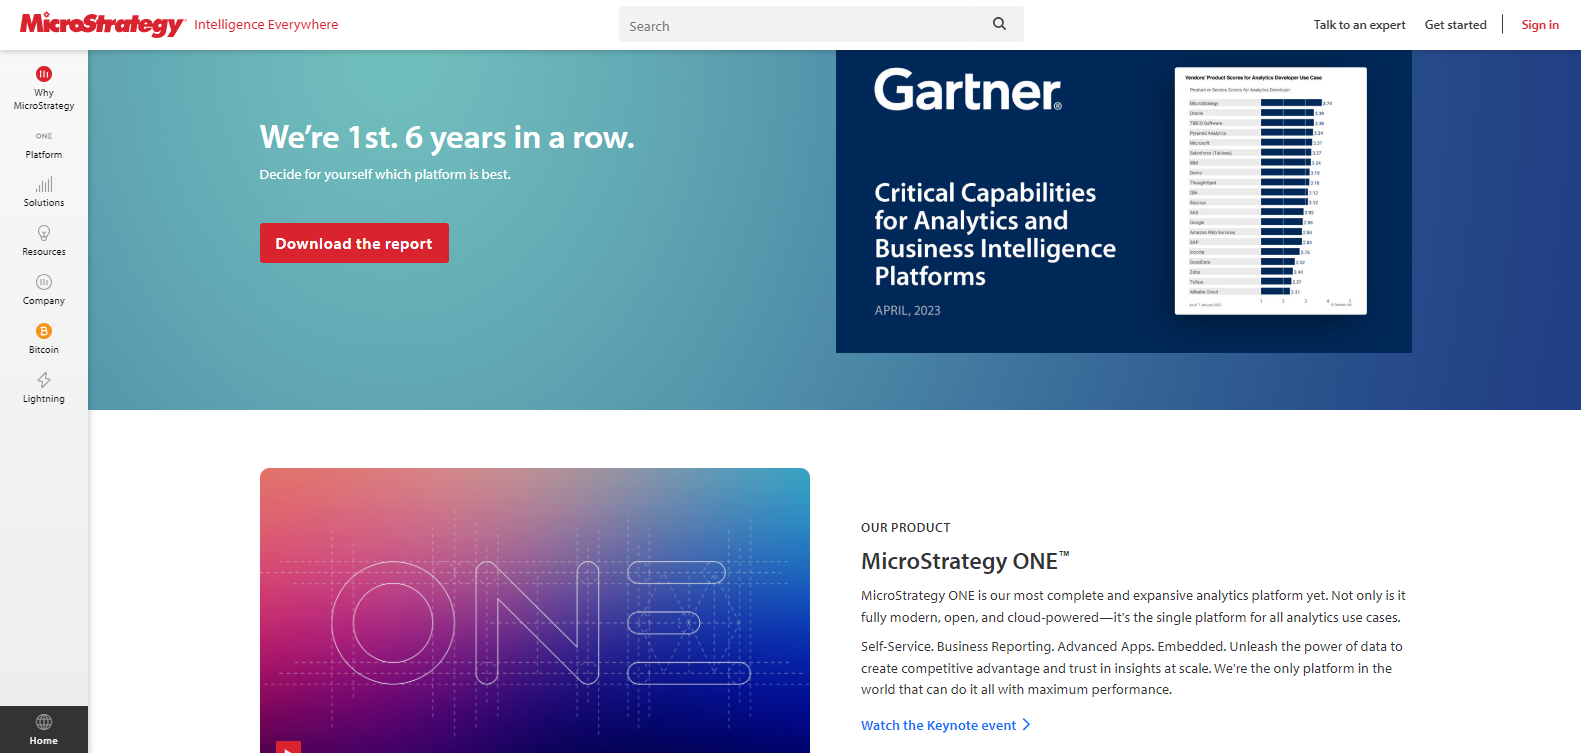
- Enterprise-grade Analytics: MicroStrategy offers robust analytics capabilities suitable for enterprise-level deployments, handling large datasets and complex analytics tasks.
- Data Discovery and Exploration: It provides intuitive data exploration and discovery features, empowering users to find valuable insights within their data.
- Data Integration: MicroStrategy seamlessly integrates with various data sources, including databases, data warehouses, and cloud platforms.
- Security and Governance: It offers robust security features and governance controls to ensure data protection and compliance.
- Advanced Analytics: MicroStrategy supports advanced analytics, including predictive analytics and data mining, for deeper insights and predictive modelling.
Use Cases and Industries Suitable for Self-Service BI Tools

Self-service BI tools find applications across various industries and use cases, including:
- Sales and marketing analytics: These tools enable businesses to analyze sales data, customer behaviour, and marketing campaigns to optimize sales strategies and improve customer targeting.
- Financial and budget analysis: Self-service BI tools allow financial professionals to analyze financial data, monitor performance, and create forecasts for better financial planning and budget management.
- Human resources and workforce management: HR departments can leverage self-service BI tools to analyze employee data, track performance metrics, and identify trends for effective talent management.
- Supply chain and inventory optimization: Self-service BI tools enable organizations to monitor and analyze supply chain data, identify bottlenecks, and optimize inventory levels for improved operational efficiency.
- Customer relationship management: These tools help businesses analyze customer data, measure customer satisfaction, and enhance customer relationship management strategies for improved customer retention and loyalty.
- Healthcare and life sciences: Self-service BI tools assist healthcare providers and researchers in analyzing patient data, clinical outcomes, and research findings to drive evidence-based decision-making and improve healthcare outcomes.
- Retail and e-commerce: These tools enable retailers to analyze sales data, inventory levels, and customer behaviour to optimize pricing strategies, product assortments, and marketing campaigns.
- Manufacturing and operations: Self-service BI tools aid manufacturers in analyzing production data, quality control metrics, and supply chain performance to enhance production efficiency and optimize operational processes.
Implementation and Adoption Challenges of Self-Service BI Tools

While self-service BI tools offer numerous benefits, their implementation and adoption may face certain challenges:
- Data quality and integrity concerns: Ensuring data accuracy, consistency, and reliability can be a challenge when multiple users have access to self-service BI tools. Organizations need to establish data governance practices and data quality frameworks to maintain data integrity.
- User training and adoption hurdles: Some users may struggle with the learning curve associated with self-service BI tools, especially if they lack prior experience in data analysis. Proper user training and support programs are essential to overcome adoption barriers.
- Organizational change management: Introducing self-service BI tools requires a cultural shift within the organization. Employees may resist change or struggle to embrace a data-driven mindset. Organizations need to communicate the benefits, provide adequate support, and foster a culture of data literacy.
- Security and privacy considerations: Self-service BI tools handle sensitive data, and organizations must implement robust security measures to protect data privacy and prevent unauthorized access. This includes user access controls, data encryption, and adherence to data protection regulations.
- Scalability and infrastructure requirements: As the volume and complexity of data grow, organizations must ensure that their infrastructure can handle the increasing demands of self-service BI tools. Scaling hardware, network, and storage resources may be necessary to support the growing data analytics needs.
Conclusion

Self-service BI tools have become invaluable assets for organizations seeking to leverage their data assets effectively. The benefits of these tools include increased agility in decision-making, improved data accessibility, and a more data-driven culture. After comparing the 8 best self-service BI tools, it is crucial for businesses to consider their specific needs, budget constraints, and user requirements when selecting the most suitable tool. By investing in the right self-service BI tool, organizations can unlock the full potential of their data and gain a competitive edge in the market.
To ensure a successful implementation and maximize the benefits of self-service BI, partnering with a trusted technology partner like Ubique Digital Solutions can be a game-changer. With their expertise and experience, Ubique Digital Solutions can guide businesses in selecting and implementing the most suitable self-service BI tool tailored to their unique requirements. Don’t miss out on the opportunity to boost your business to success. Contact Ubique Digital Solutions today.
FAQs
Q: What is the difference between self-service BI and traditional BI?
Self-service BI empowers end-users to independently access and analyze data, while traditional BI often requires involvement from IT or data experts for data access and analysis.
Q: Are self-service BI tools suitable for small businesses?
Yes, self-service BI tools can be beneficial for small businesses as they offer cost-effective and user-friendly solutions to analyze data and make data-driven decisions.
Q: Can self-service BI tools handle big data?
Yes, many self-service BI tools are designed to handle big data by providing scalable data processing and storage capabilities.
Q: Are these tools compatible with different data sources and formats?
Yes, self-service BI tools are typically designed to support various data sources and formats, including databases, spreadsheets, cloud services, and APIs.


