
Nowadays, using tools to understand data is super important. These tools help companies see what’s going on with their info and decide smartly. They turn raw data into easy-to-understand charts and reports, giving a big picture of how things are going. This helps spot trends, patterns, and chances to grow.
Business intelligence (BI) reporting involves the process of analyzing and presenting data in a format that is easily understandable and actionable. It allows businesses to leverage their data to gain valuable insights, monitor key performance indicators (KPIs), and support decision-making processes. Reporting tools play a pivotal role in this process by providing the necessary functionality to extract, analyze, and visualize data effectively.
Benefits of Using BI Reporting Tools

Improved Decision-Making
Reporting tools enable data-driven decision-making processes by providing accurate, up-to-date insights. By accessing real-time or near real-time reports, businesses can make informed decisions based on the most current data available. This helps them respond quickly to market changes, identify emerging trends, and seize opportunities ahead of competitors.
Enhanced Data Visualization
Data visualization is a powerful way to understand complex datasets. BI reporting tools offer various visualization techniques, such as charts, graphs, and interactive dashboards, which allow businesses to present data in a visually appealing and easy-to-understand manner. Visualizations aid in identifying patterns, outliers, and correlations, enabling stakeholders to grasp insights quickly and make data-backed decisions.
Increased Efficiency
Automation and self-service features offered by reporting tools streamline the reporting process. These tools eliminate the need for manual data manipulation, aggregation, and formatting, saving valuable time and reducing the risk of human errors. Additionally, automated scheduling and report distribution ensure that stakeholders receive the right information at the right time, improving overall efficiency.
Top 10 BI Reporting Tools
Tableau
Tableau is a leading BI reporting tool known for its user-friendly interface and powerful data visualization capabilities. It offers a wide range of visualizations, including charts, graphs, maps, and dashboards, allowing users to explore and present data effectively. Tableau supports data integration from multiple sources and provides advanced analytics features for in-depth insights.
Features:
- User-friendly interface
- Powerful data visualization capabilities
- Various visualizations: charts, graphs, maps, dashboards
- Enables effective data exploration and presentation
- Supports integration from multiple data sources
- Provides advanced analytics for detailed insights
Microsoft Power BI
Microsoft Power BI is a popular BI reporting tool that offers seamless integration with Microsoft’s ecosystem, making it convenient for organizations already using Microsoft products. It provides interactive dashboards, visualizations, and self-service analytics. Power BI connects to various data sources, and its collaboration features enable users to share and collaborate on reports and dashboards.
Features:
- Seamless Integration: Works smoothly with other Microsoft products, making it easy for organizations already using them.
- Interactive Dashboards: Allows users to interact with data visually, enhancing understanding and analysis.
- Visualizations: Transforms data into easy-to-understand charts and graphs for better insights.
Self-Service Analytics: Enables users to analyze data on their own without needing IT assistance. - Connects to Multiple Data Sources: Can pull data from various sources, allowing for comprehensive analysis.
- Collaboration Features: Facilitates sharing and collaboration on reports and dashboards, promoting teamwork and knowledge sharing.
Databox
Databox stands out as one of the best business intelligence (BI) reporting tools available in the market today. With its comprehensive and intuitive features, Databox empowers businesses to unlock valuable insights from their data and make informed decisions.
Features:
- Easy data integration: Connect and integrate data from various sources like databases, spreadsheets, and cloud apps effortlessly.
- Customizable visualizations: Choose from a wide range of charts, graphs, and dashboards to present data in a compelling and easy-to-understand way.
- Real-time monitoring and alerts: Stay updated with the latest trends and key metrics through real-time data monitoring and alerts
SAP BusinessObjects
SAP BusinessObjects is an enterprise-grade BI reporting tool that offers a comprehensive suite of reporting, analytics, and visualization solutions. It works with both SAP and non-SAP data sources, which is great for big companies with lots of different data.
Features:
- Ad hoc reporting
- Pixel-perfect document-style reporting
- Interactive dashboards
Looker
Looker is a modern cloud-based BI reporting tool that focuses on data exploration and collaboration.
Features:
- Intuitive interface
- Advanced analytics like machine learning and predictive modeling
- Interactive dashboards
- Ad hoc analyses
- Easy sharing of insights
- Works with different data sources
- Strong security and governance features
Domo
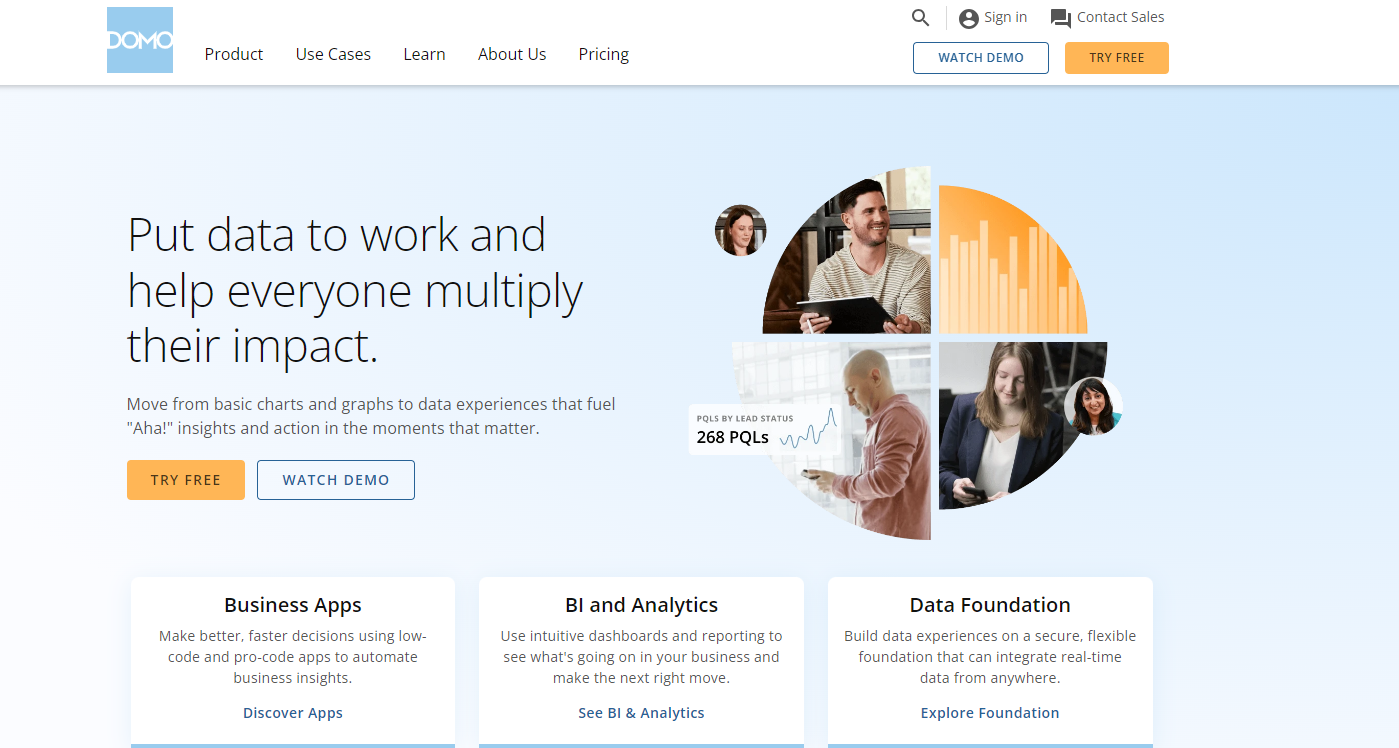
Domo is a cloud-based BI reporting tool designed for both business users and IT professionals.
Features:
- Connects easily to many data sources.
- Make your own dashboards and reports, just the way you like.
- Helps get your data ready for analysis.
- Keeps your data safe and organized.
- Keeps you updated on what’s important.
Sisense
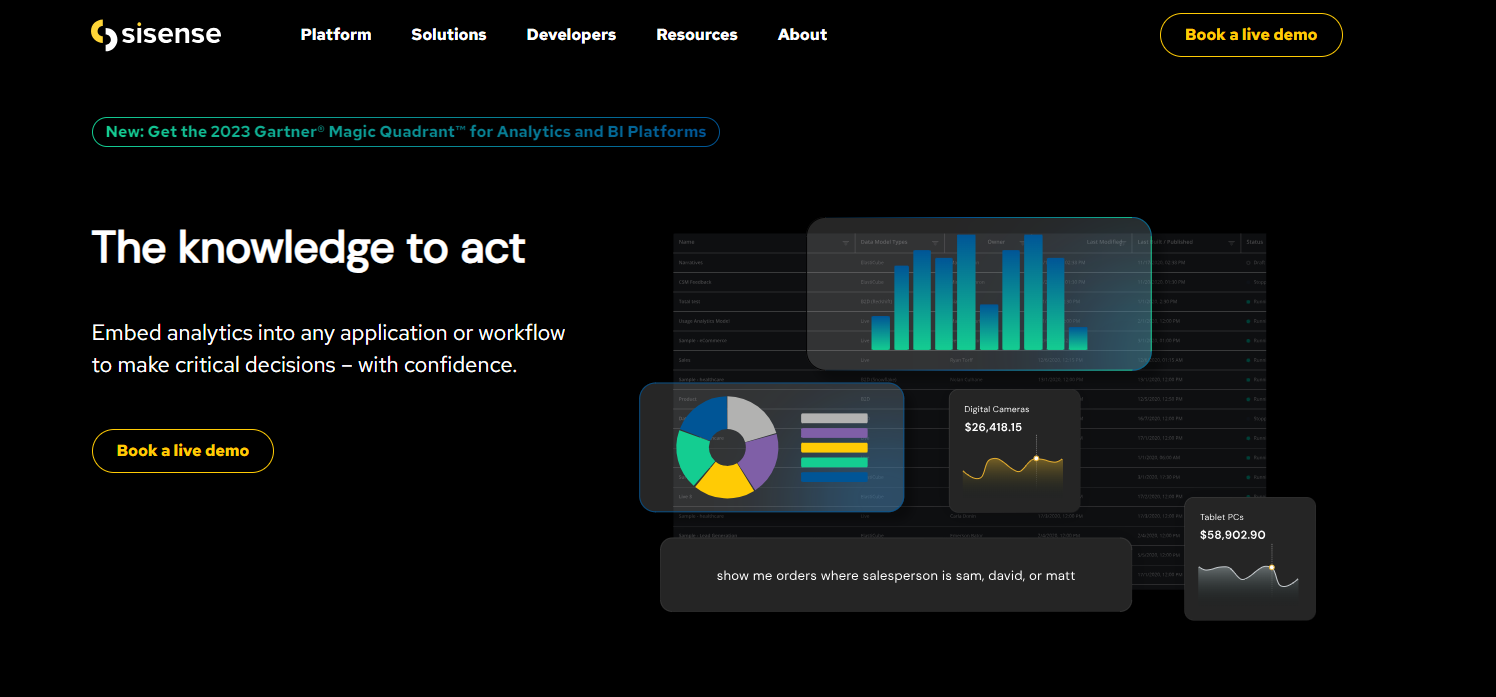
Sisense is a comprehensive BI reporting tool that enables organizations to analyze large and complex datasets.
Features:
- Gives smart insights using AI and understands human language.
- Makes interactive dashboards and visualizations.
- You can put its analytics right into other apps.
- It’s fast and can handle lots of data without a problem.
MicroStrategy
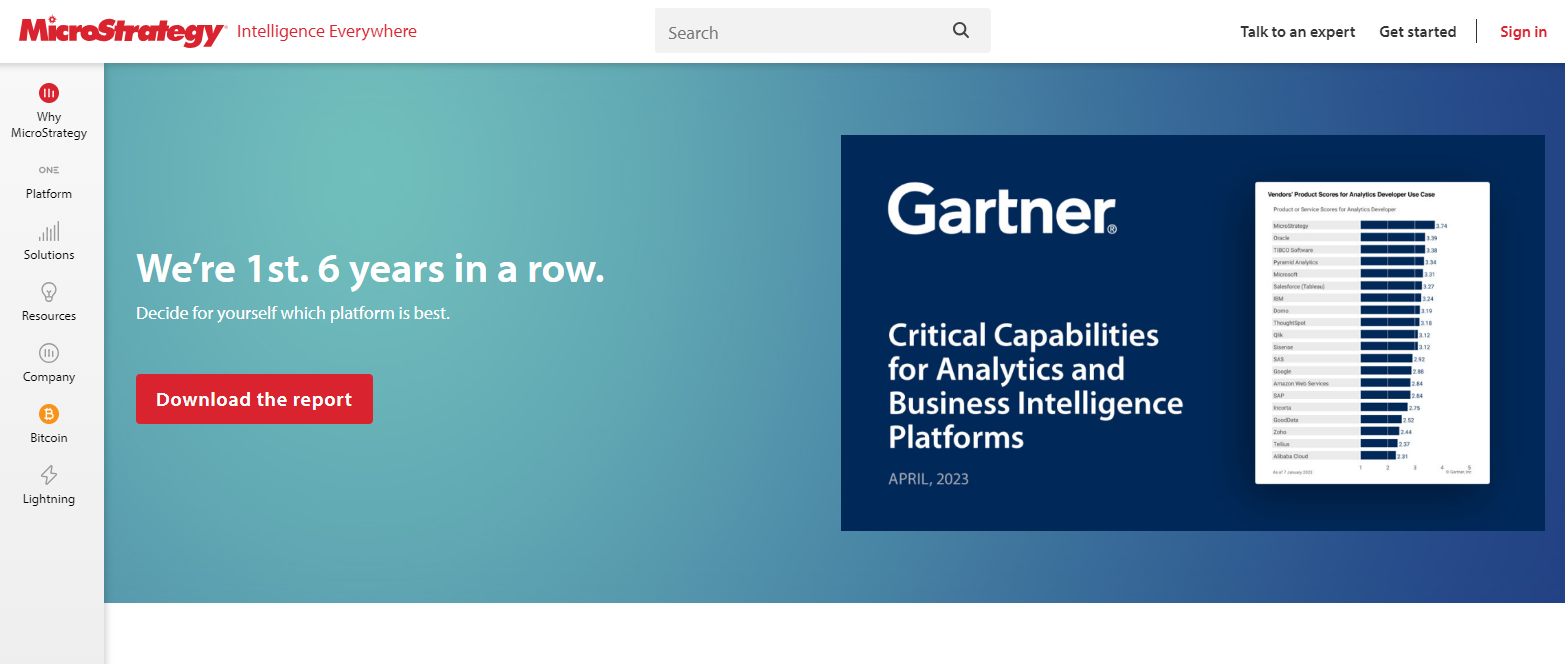
MicroStrategy is an enterprise-level BI reporting tool that offers a broad range of capabilities, including reporting, analytics, and mobile BI.
Features:
- Interactive dashboards
- Scorecards
- Pixel-perfect reports
- Works with different data sources
- Security and governance features for big organizations
Qlik

Features:
Qlik offers a suite of tools, including QlikView for guided analytics and Qlik Sense for self-service analytics. It employs an associative data engine, enabling users to probe all the possible associations in their data.
Pricing:
Qlik Sense has a subscription pricing model.Pricing starts at $30 per user per month for Qlik Sense Business. For Qlik Sense Enterprise, pricing details are available upon request.
Integration:
Qlik offers integration with a wide array of data sources including databases, spreadsheets, and cloud services.
Advantages:
Qlik’s associative data engine is its standout feature, enabling intuitive and free-form data exploration. It’s also highly customizable and allows for complex analysis.
IBM Cognos Analytics
- Answers key business questions quickly.
- Advanced Predictive (AP) techniques
- Collective intelligence
- Collaboration and social networking
- Real-time responsiveness
Need help with data analysis?
Let’s make your data work for you. To learn more about data visualization using BI tools, reach out to Ubique Digital Solutions today.
FAQs
Q: What is the difference between business intelligence reporting and traditional reporting?
Business intelligence reporting goes beyond traditional reporting by providing advanced analytics, interactive visualizations, and real-time data insights. It enables businesses to make data-driven decisions by leveraging comprehensive and up-to-date information.
Q: How can business intelligence reporting tools help improve data accuracy?
Business intelligence reporting tools have built-in data cleansing and validation mechanisms, ensuring data accuracy. By automating data processing and eliminating manual errors, these tools enhance the reliability of reports and dashboards.
Q: Are these tools suitable for small businesses, or are they more beneficial for large enterprises?
Business intelligence reporting tools cater to businesses of all sizes. While large enterprises may have more extensive data requirements, small businesses can still benefit from these tools by gaining insights into their operations, customer behavior, and market trends.
Q: Can I integrate these reporting tools with other software applications?
Yes, most BI reporting tools offer integration capabilities with other software applications. They can connect to various data sources, databases, and cloud platforms, enabling seamless data integration and consolidation.
Q: What factors should I consider when selecting a business intelligence reporting tool?
When selecting a BI reporting tool, consider factors such as ease of use, scalability, integration capabilities, available visualizations, security features, customer support, and pricing. It is crucial to align the tool’s features and functionalities with your specific business needs and data requirements.
")

")


