What is Google Data Studio?
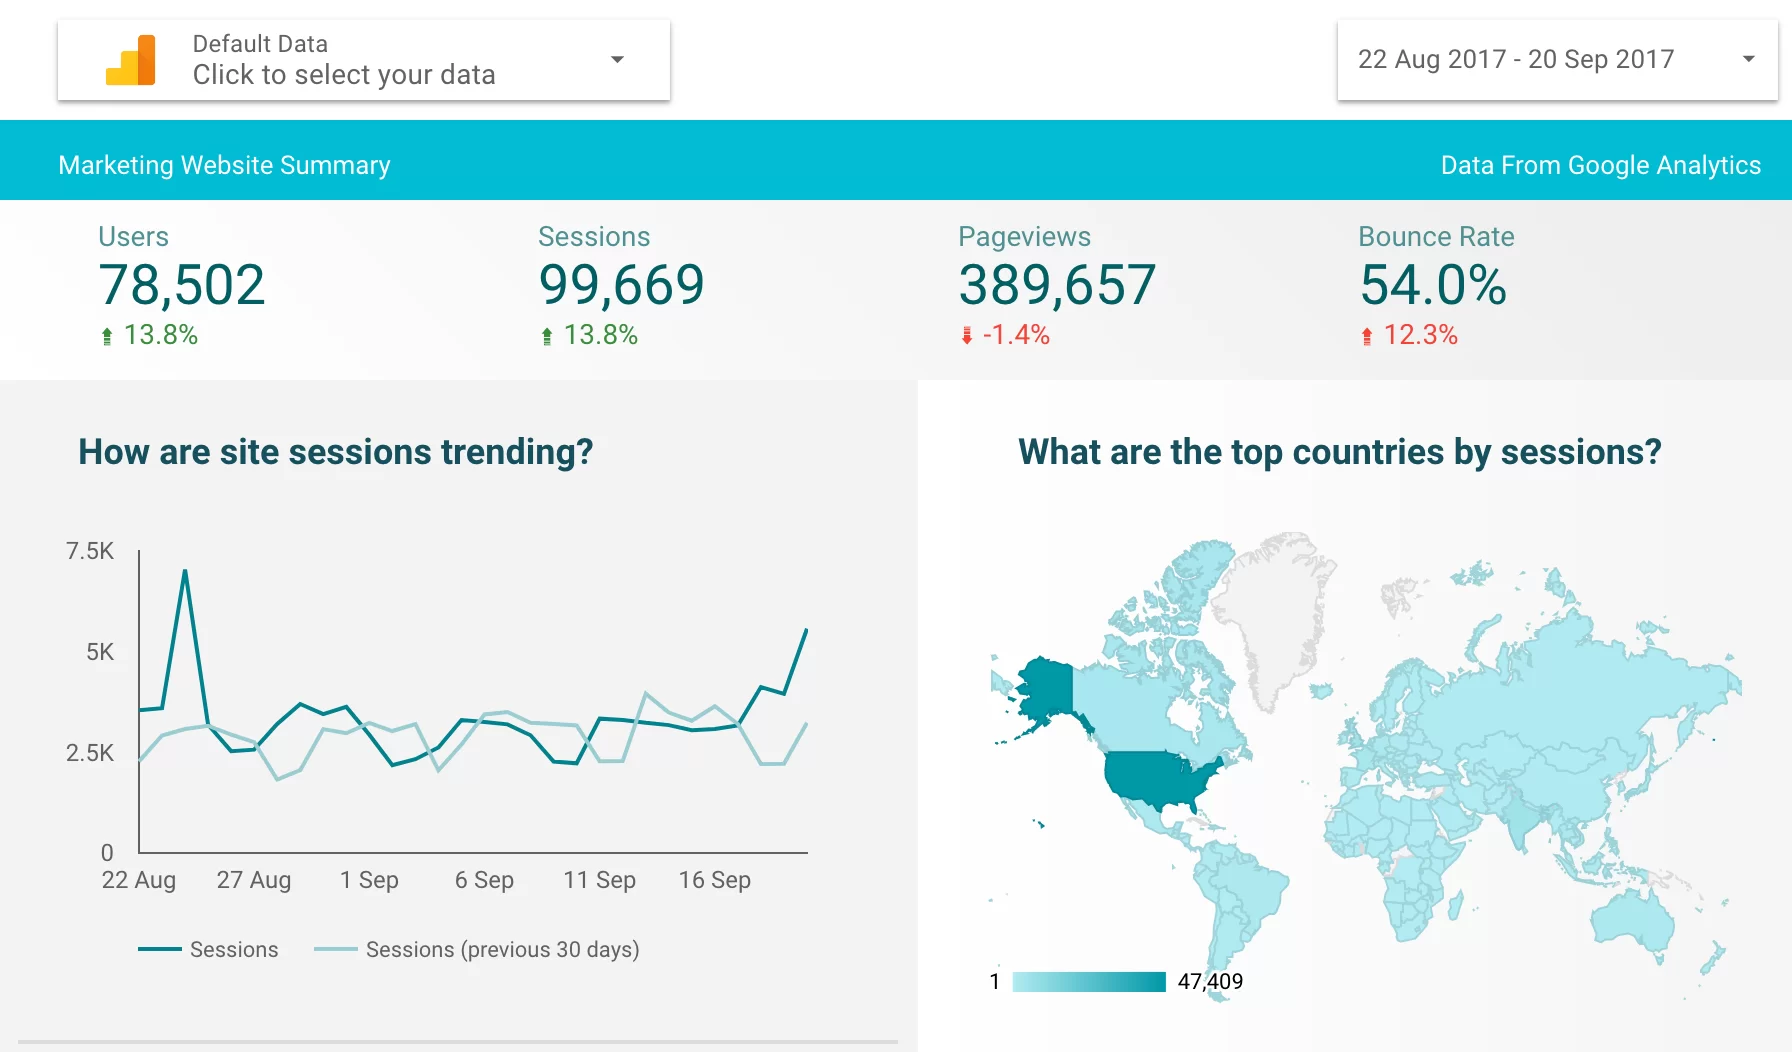
Google Data Studio is a free, cloud-based tool for data visualisation and reporting. Launched by Google in 2016, it has rapidly evolved to become a primary choice for many businesses and individuals. It allows users to create interactive reports and dashboards by connecting to various data sources. The key features of Google Data Studio include its integration with multiple Google services (like Google Analytics, Google Sheets, and Google Ads) and third-party sources, its real-time data processing, and its highly customisable nature. The benefits of using Google Data Studio include enhanced data collaboration, ease of use, and the ability to create comprehensive, visually appealing reports.
Core Components of Google Data Studio
Google Data Studio’s core components include data connectors, report creation, and collaboration features. Data connectors allow seamless integration with various data sources, both within and outside the Google ecosystem. Users can create and customise reports using a variety of templates and tools, making it easier to transform data into actionable insights. The platform also supports robust collaboration features, enabling teams to work together on data reports, share insights, and make collective decisions based on the same data sets.
How Google Data Studio Works
Setting Up Google Data Studio
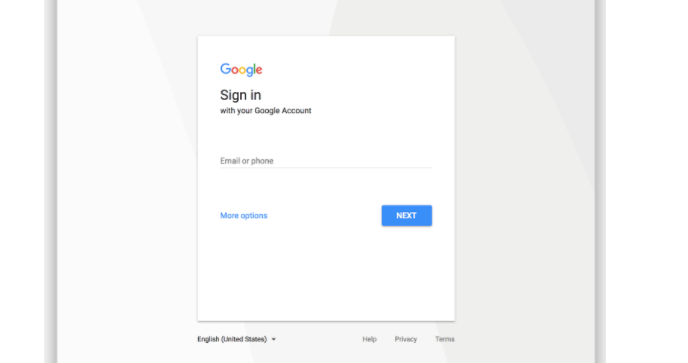
Setting up Google Data Studio involves creating a Google account and accessing the Data Studio website. The user interface is intuitive, featuring a simple dashboard with options to create new reports, connect to data sources, and access existing reports. First-time users can navigate through a guided tour to familiarise themselves with the platform’s features and functionalities.
Creating Your First Report
Creating a report in Google Data Studio starts with selecting data sources, which can range from Google Analytics to external databases. Users have the option to use pre-built templates or start from scratch, allowing flexibility in report design. Basic customisation options include adding charts, graphs, and filters to represent data visually. These elements can be dragged and dropped onto the canvas, making report creation both simple and interactive.
Advanced Features
For more advanced users, Google Data Studio offers features like custom formulas and calculated fields, which allow for more in-depth data analysis. Reports can be embedded on websites, providing live, interactive data visualisations. Another significant feature is the ability to set up automation and real-time data updates, ensuring that the reports always reflect the most current data.
Google Data Studio is a powerful data visualisation and reporting tool that allows users to create interactive and customisable reports and dashboards. It offers various advanced features to help users make the most out of their data.
Here are some advanced features of Google Data Studio:
Data Blending
Google Data Studio allows you to blend data from multiple data sources into a single report. This is useful when you have data stored in different places and want to create unified visualisations.
Calculated Fields
You can create calculated fields within Data Studio to perform various calculations on your data. This includes mathematical operations, date manipulation, string concatenation, and more. This feature helps you derive insights from your data without altering the original dataset.
Community Connectors
Data Studio offers a range of pre-built connectors to various data sources like Google Analytics, Google Ads, Google Sheets, and more. Additionally, you can use Community Connectors to connect to third-party data sources not covered by the standard connectors.
Parameter Controls
Parameters allow you to create dynamic and interactive reports. Users can adjust parameter values to filter data, change date ranges, or select specific dimensions and metrics without having to edit the report itself.
Data Studio API
The Data Studio API enables programmatic access to Data Studio reports and dashboards. You can use this API to automate report generation, integrate with other tools, or create custom solutions.
Style and Theming
You can customise the look and feel of your reports by applying themes, custom colour palettes, and fonts. This helps you maintain brand consistency in your reports.
Interactive Features
Data Studio offers interactive elements like drop-down menus, sliders, and checkboxes that allow users to interact with the data and control what they see in real-time.
Google BigQuery Integration
If you’re using Google BigQuery as your data warehouse, you can seamlessly integrate it with Data Studio. This enables you to work with large datasets and create reports with lightning-fast performance.
Geo Mapping
Data Studio provides geospatial visualisation options, allowing you to create maps and display geographic data. You can use custom geocoding to map data at various levels, from countries to postal codes.
Advanced Chart Types
Data Studio supports various chart types beyond the basics, such as scatter plots, bullet charts, heatmaps, and area charts. These charts can help you visualise data in more meaningful ways.
Embedding and Sharing
You can easily embed Data Studio reports and dashboards in websites or share them with others. You can also set up automatic email delivery of reports on a schedule.
Data Filters and Controls
Data Studio offers multiple filtering options, including data source filters, report-level filters, and page-level filters. You can also use controls like date pickers and dropdowns to allow users to filter data interactively.
Data Drilldown
Users can drill down into data to explore details. You can set up drill-down actions to provide a hierarchical view of data, allowing users to click on a chart element to see more detailed information.
Custom Scripting
For advanced users, Data Studio allows the use of custom JavaScript in calculated fields and charts, enabling even more flexibility and customisation in report creation.
These advanced features of Google Data Studio make it a versatile tool for data visualization and reporting, suitable for a wide range of data analysis and reporting needs.
Comparing Google Data Studio with Other Tools
Compared to traditional spreadsheet software, Google Data Studio offers more advanced visualisation capabilities and easier integration with various data sources. While spreadsheets are excellent for data storage and basic analysis, Data Studio excels in turning that data into interactive, easy-to-digest visual reports.
Tableau
Pros: Tableau is known for its robust capabilities in data visualisation and analytics. It offers a wide range of chart types, advanced calculations, and a strong community of users. It also has a desktop version for offline analysis.
Cons: Tableau can be more complex and expensive compared to Data Studio, making it better suited for larger enterprises.
Power BI
Pros: Microsoft Power BI is a user-friendly tool with excellent integration with other Microsoft products. It offers advanced analytics capabilities and a variety of data connectors. It’s suitable for businesses already using Microsoft’s ecosystem.
Cons: The free version of Power BI has limitations, and more advanced features come with a higher cost.
QlikView/Qlik Sense
Pros: Qlik offers powerful data visualisation, associative data modeling, and a unique approach to data exploration. It’s great for in-memory analytics and data discovery.
Cons: It can be expensive, and the learning curve for some users may be steeper compared to other tools.
Domo
Pros: Domo is a cloud-based platform that combines data visualisation with business intelligence and collaboration features. It’s known for its ease of use and is suitable for smaller businesses.
Cons: Pricing can be a concern for businesses that need extensive data sources and users.
Klipfolio
Pros: Klipfolio is a dashboard and reporting tool with a focus on real-time data and integrations. It’s user-friendly and well-suited for small to medium-sized businesses.
Cons: It may not have the same level of complexity and customisation options as some other tools.
Google Data Studio is an excellent choice for those who prefer a free, cloud-based solution with seamless integration with Google’s ecosystem and a straightforward learning curve, especially if you’re already using other Google products. However, for more advanced analytics and complex reporting requirements, you may want to explore other options like Tableau, Power BI, or Looker.
Conclusion
Google Data Studio is a powerful tool for turning raw data into insightful reports, perfect for data-driven decision-making. For optimal results, consider partnering with Ubique Digital Solutions, a trusted expert in digital marketing solutions. With a proven track record, our team can leverage the full potential of digital services to elevate your business. Take the next step toward data-driven success and contact Ubique Digital Solutions today.
FAQs
Q: What is the cost of using Google Data Studio?
Google Data Studio is a free tool, making it accessible to a wide range of users.
Q: Can Google Data Studio handle large datasets?
Yes, it is capable of handling large datasets, but performance may vary based on the complexity and size of the data.
Q: How does Google Data Studio ensure data security?
It adheres to Google’s strict security standards, ensuring data is protected and confidential.
Q: Can non-technical users easily adapt to Google Data Studio?
Its user-friendly interface and intuitive design make it accessible even to non-technical users.
Q: What are the limitations of Google Data Studio?
While versatile, it may lack some advanced analytical features found in specialized data analysis tools.