Understanding Key Performance Indicators (KPIs)
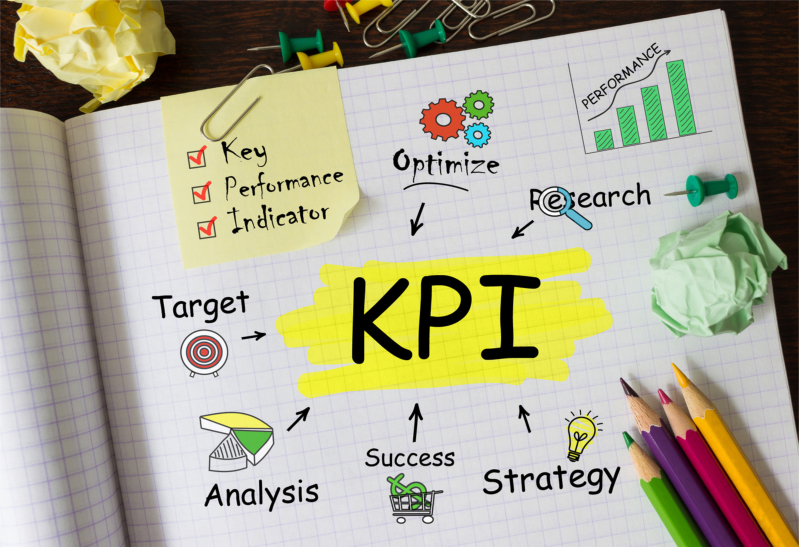
Key Performance Indicators (KPIs) play a crucial role in project management. KPIs are measurable metrics that provide insights into project performance and help organizations track progress towards their goals. By tracking and measuring project performance using KPIs, project managers can make informed decisions, identify areas for improvement, and ensure project success.
The importance of tracking and measuring project performance cannot be overstated. It allows project managers to assess whether projects are on track, identify potential bottlenecks, and make timely adjustments to ensure successful outcomes. KPIs serve as a quantifiable benchmark for project success, enabling project teams to align their efforts with organizational goals and objectives.
KPIs drive project success by providing a clear and objective view of project performance. They help project managers and stakeholders evaluate project progress, identify deviations from the planned trajectory, and take corrective actions when necessary. By focusing on key indicators, project teams can proactively address challenges, optimize resources, and achieve strategic goals.
In this blog, we will explore 15 important project management KPIs for 2023. These KPIs have been carefully selected based on their relevance and impact on project success. By understanding and implementing these KPIs, project managers can effectively monitor and measure project performance, leading to improved decision-making and better outcomes.
The 15 Important Project Management KPIs for 2023
KPI #1: Schedule Adherence
Schedule adherence is a critical KPI that measures how well a project sticks to its planned timeline. It plays a vital role in determining if the project is on track and meeting deadlines. Adhering to the schedule ensures timely completion of tasks, avoids delays, and allows for effective resource allocation. Schedule adherence is particularly crucial for maintaining project momentum, managing dependencies, and ensuring that all stakeholders are aligned.
Measurement Metrics:
- Planned vs. Actual Start Dates: This metric compares the scheduled start dates of project activities with the actual start dates to assess adherence. It helps identify any delays or early starts, providing insights into schedule performance.
- Planned vs. Actual End Dates: This metric compares the scheduled end dates of project activities with the actual end dates to evaluate schedule adherence. It helps identify whether tasks are being completed within the expected timeframes.
- Milestone Achievement: Tracking the completion of critical project milestones within the specified time frame is another essential metric for schedule adherence. Milestones serve as key indicators of progress and can help identify any deviations from the planned schedule.
KPI #2: Budget Variance
Budget variance is a crucial KPI that measures the difference between the planned budget and the actual expenses incurred during a project. It helps monitor project costs and ensures that the project remains within budget. Tracking budget variance allows project managers to identify cost overruns, implement corrective actions, and maintain financial control. It also helps in making informed decisions regarding resource allocation and project prioritization.
Measurement Metrics:
- Planned Budget vs. Actual Cost: This metric compares the planned budget with the actual expenses incurred to evaluate budget adherence. It provides an overview of the project’s financial performance and helps identify any deviations from the planned budget.
- Cost Performance Index (CPI): CPI is a ratio that determines the cost efficiency of the project by comparing the value of work accomplished to the actual costs. It indicates whether the project is under or over budget.
- Earned Value (EV): EV measures the value of work completed compared to the planned budget. It provides insights into budget variance and project performance. By comparing the planned value (PV) with the earned value (EV), project managers can assess whether the project is on track financially.
#3: Quality Metrics
Quality metrics play a vital role in measuring the quality of project deliverables and ensuring that they meet predefined standards. Tracking quality metrics helps identify any potential issues or deviations from the desired quality level. It ensures that the project’s outputs meet or exceed the expectations of stakeholders, resulting in higher customer satisfaction and project success.
Measurement Metrics:
- Defect Density: This metric measures the number of defects or issues found per unit of deliverable or project component. It helps gauge the overall quality level and identifies areas that require improvement.
- Customer Satisfaction Index: Customer satisfaction is a critical aspect of project success. This metric measures the satisfaction levels of project stakeholders, including clients, sponsors, and team members. It can be assessed through surveys, feedback ratings, or Net Promoter Score (NPS) to gather insights into stakeholder satisfaction.
- Error Rate: This metric tracks the number of errors or mistakes identified during project execution. It helps identify areas where processes or deliverables need improvement to minimize errors and ensure quality.
#4: Resource Utilization
Resource utilization is an important KPI that tracks the efficient utilization of project resources, including human resources, equipment, and materials. Effective resource utilization ensures optimal allocation, minimizes waste, and maximizes productivity. It helps identify resource bottlenecks, underutilization, or overutilization, allowing project managers to make necessary adjustments and maintain resource balance.
Measurement Metrics:
- Resource Utilization Rate: This metric calculates the percentage of time or capacity that resources are actively engaged in project activities. It provides insights into resource efficiency and helps identify any underutilized or overutilized resources.
- Resource Allocation vs. Capacity: This metric compares the allocated resources to the available capacity to determine if the resources are being utilized optimally. It helps identify any gaps or excesses in resource allocation.
- Task Distribution: Task distribution measures how work is distributed among resources. It helps assess workload balance and ensures that tasks are assigned appropriately based on resource capabilities and availability.
#5: Stakeholder Satisfaction
Stakeholder satisfaction is a critical KPI that measures the satisfaction levels of project stakeholders, including clients, sponsors, and team members. It reflects the overall success of the project in meeting stakeholder expectations and building positive relationships. High stakeholder satisfaction is crucial for project support, ongoing collaboration, and securing future opportunities.
Measurement Metrics:
- Stakeholder Surveys: Surveys can be conducted to gather feedback from stakeholders regarding their satisfaction levels with project deliverables, communication, and overall project experience. Survey results provide quantitative and qualitative data to assess stakeholder satisfaction.
- Feedback Ratings: Feedback ratings collected from stakeholders help gauge their satisfaction levels. This can be done through rating scales or structured feedback forms, allowing stakeholders to express their opinions and concerns.
- Net Promoter Score (NPS): NPS is a metric that measures stakeholder loyalty and satisfaction. It involves asking stakeholders a simple question: “How likely are you to recommend this project to others?” The responses are used to calculate the NPS, which categorizes stakeholders as promoters, passives, or detractors.
#6: Risk Indicators
Risk indicators are essential KPIs that identify and monitor potential risks that may impact project success. Effective risk management is crucial for minimizing the likelihood and impact of risks. By tracking risk indicators, project managers can proactively address risks, implement mitigation strategies, and ensure project resilience.
Measurement Metrics:
- Risk Exposure: Risk exposure quantifies the potential impact of identified risks on the project. It assesses the severity and probability of risks, allowing project managers to prioritize risk mitigation efforts.
- Risk Severity: Risk severity measures the potential consequences or impacts of identified risks. It helps project managers understand the severity levels of risks and prioritize mitigation actions accordingly.
- Risk Mitigation Progress: This metric measures the progress made in implementing risk mitigation strategies. It tracks the completion of risk mitigation activities, ensuring that risks are effectively managed throughout the project lifecycle.
#7: Change Control Effectiveness
Change control effectiveness is a KPI that measures the effectiveness of change control processes in managing project changes and ensuring their impact on project scope, schedule, and budget. Effective change control processes are essential for managing change requests, evaluating their impacts, and maintaining project stability.
Measurement Metrics:
- Change Request Approval Rate: This metric measures the percentage of change requests that are approved. It helps assess the efficiency and effectiveness of the change control process in evaluating and approving changes.
- Change Request Closure Time: This metric measures the time taken to close change requests, from initiation to approval and implementation. It helps assess the efficiency of the change control process and the promptness in addressing requested changes.
- Change Request Impact Analysis: This metric measures the rigor and thoroughness of the impact analysis conducted for change requests. It ensures that the potential impacts of changes on project scope, schedule, and budget are properly assessed and evaluated.
KPI #8: Customer Satisfaction
Customer satisfaction is a vital KPI that measures the satisfaction of project customers and clients regarding the project deliverables, service, and overall experience. High customer satisfaction levels lead to client loyalty, positive references, and potential future business opportunities.
Measurement Metrics:
- Customer Satisfaction Surveys: Surveys are conducted to gather feedback from customers regarding their satisfaction levels with project deliverables, service quality, and overall experience. Survey results provide quantitative and qualitative data to assess customer satisfaction.
- Customer Feedback Ratings: Feedback ratings collected from customers help gauge their satisfaction levels. This can be done through rating scales, feedback forms, or customer reviews, allowing customers to express their opinions and provide feedback on their experience.
- Repeat Business: Repeat business measures the percentage of customers who continue to engage or work with the organization on subsequent projects or initiatives. It indicates the level of customer satisfaction and the organization’s ability to retain customers.
KPI #9: Team Performance
Team performance is a crucial KPI that evaluates the performance and productivity of the project team. It measures the team’s ability to meet project objectives, deliver quality work, and collaborate effectively.
Measurement Metrics:
- Team Efficiency: Team efficiency measures the team’s ability to complete tasks and deliverables within the allocated timeframes and with minimal rework. It helps assess the team’s productivity and overall performance.
- Task Completion Rate: Task completion rate tracks the percentage of tasks or deliverables completed by the team within a given period. It provides insights into the team’s progress and adherence to project timelines.
- Teamwork Ratings: Teamwork ratings capture feedback from team members and stakeholders regarding the team’s collaboration, communication, and overall effectiveness. It helps assess the team’s ability to work together harmoniously and achieve project objectives.
KPI #10: Scope Creep
Significance: Scope creep is a KPI that measures the extent of uncontrolled project scope expansion. It refers to the continuous addition of project requirements or changes beyond the agreed-upon scope. Scope creep can lead to budget and schedule overruns, jeopardizing project success.
Measurement Metrics:
- Number of Scope Changes: This metric tracks the number of changes or additions made to the project scope throughout its lifecycle. It provides insights into the frequency and extent of scope creep.
- Scope Change Request Approval Rate: This metric measures the percentage of scope change requests that are approved. It helps assess the project’s ability to manage scope changes effectively and control scope creep.
- Scope Change Impact Analysis: This metric measures the rigor and thoroughness of the impact analysis conducted for scope change requests. It ensures that the potential impacts of scope changes on project objectives, deliverables, and resources are properly evaluated.
KPI #11: Communication Effectiveness
Communication effectiveness is a crucial KPI that measures the effectiveness of project communication channels and strategies. Effective communication ensures that information is conveyed accurately, timely, and comprehensively to all stakeholders, fostering collaboration and alignment.
Measurement Metrics:
- Communication Response Time: This metric measures the average time taken to respond to communication, such as emails, messages, or requests. It reflects the timeliness and responsiveness of project team members in addressing communication.
- Meeting Attendance Rate: Meeting attendance rate tracks the percentage of stakeholders or team members attending project meetings. It indicates the level of engagement and participation in project communication and collaboration efforts.
- Communication Survey Results: Surveys or feedback ratings related to communication can provide insights into stakeholders’ perceptions of communication effectiveness. They help identify areas of improvement and ensure that communication channels and strategies meet stakeholders’ needs.
KPI #12: Client Retention
Significance: Client retention is a KPI that measures the ability to retain clients and secure future business opportunities. High client retention rates indicate client satisfaction, trust, and ongoing business relationships.
Measurement Metrics:
- Client Retention Rate: This metric measures the percentage of clients or customers who continue to engage or work with the organization on subsequent projects or initiatives. It reflects the organization’s ability to meet client expectations and deliver value consistently.
- Repeat Business: Similar to the customer satisfaction metric, repeat business measures the percentage of clients who engage the organization for multiple projects or initiatives. It indicates the level of client satisfaction and loyalty.
- Customer Loyalty: Customer loyalty captures the extent to which clients express loyalty, satisfaction, and preference for the organization’s services. It can be measured through feedback, testimonials, or customer loyalty programs.
KPI #13: Issue Resolution Time
Issue resolution time is a KPI that measures the time taken to resolve project issues and minimize their impact on project progress. Prompt issue resolution helps maintain project momentum, avoid delays, and ensure smooth project execution.
Measurement Metrics:
- Issue Resolution Time: This metric tracks the average time taken to resolve project issues from the time they are reported or identified. It helps assess the efficiency and effectiveness of issue resolution processes.
- Issue Escalation Rate: Issue escalation rate measures the frequency of issue escalations or the need to elevate issues to higher levels of management or stakeholders. It helps identify any systemic issues or bottlenecks in issue resolution.
- Issue Closure Rate: Issue closure rate tracks the percentage of issues that are successfully closed within a given period. It provides insights into the team’s ability to address and resolve project issues promptly.
KPI #14: Resource Allocation Efficiency
Resource allocation efficiency is a KPI that measures the efficiency of resource allocation in terms of optimizing resource utilization and meeting project requirements. Effective resource allocation ensures that the right resources are allocated to the right tasks at the right time.
Measurement Metrics:
- Resource Allocation vs. Demand: This metric compares the allocated resources to the project’s resource demand. It helps identify any resource shortages or excesses and ensures that resources are allocated optimally based on project needs.
- Resource Availability: Resource availability measures the percentage of time or capacity that resources are available for project work. It helps assess the availability and readiness of resources to take on assigned tasks.
- Resource Utilization: Resource utilization measures the percentage of time or capacity that resources are actively engaged in project work. It helps assess the efficiency and productivity of resource allocation.
KPI #15: Return on Investment (ROI)
Return on Investment (ROI) is a financial KPI that measures the financial returns or benefits generated from the project compared to the investment made. It helps assess the project’s profitability, cost-effectiveness, and value generation.
Measurement Metrics:
- ROI Ratio: ROI ratio calculates the financial returns or benefits generated from the project as a ratio of the investment made. It provides a quantifiable measure of the project’s financial success.
- Cost-Benefit Analysis: Cost-benefit analysis compares the costs incurred for the project against the expected benefits or returns. It helps evaluate the cost-effectiveness and financial viability of the project.
- Value Created: Value created measures the value or benefits generated beyond the financial returns. It takes into account non-monetary benefits such as improved customer satisfaction, enhanced reputation, or strategic advantages gained from the project.
Conclusion
Using Key Performance Indicators (KPIs) is vital for effective project management. By implementing these KPIs, project managers can track and measure performance, identify areas for improvement, and make informed decisions. Tracking project performance using KPIs offers numerous benefits, including better resource allocation, improved risk management, enhanced stakeholder communication, and the ability to align projects with organizational strategies and goals. As project management evolves in 2023, it is essential for project managers to embrace these KPIs and leverage their power to drive project.
To further boost your business and maximize the potential of these project management KPIs, we encourage you to partner with Ubique Digital Solutions. With our expertise in project management and cutting-edge technology solutions, we can help you implement and optimize the use of KPIs in your projects. Our tailored solutions will enable you to track and analyze project performance, streamline processes, and make data-driven decisions. Together, we can propel your business towards greater success in 2023 and beyond. Contact us today to learn more about how Ubique Digital Solutions can support your project management endeavors.
FAQs
Q: What distinguishes KPIs from metrics in project management?
Metrics are quantitative measurements used to evaluate various project aspects like cost, schedule, and quality, providing specific data on project performance. In contrast, KPIs are a subset of metrics strategically chosen to measure progress towards specific goals. Derived from metrics, KPIs offer valuable insights into project success and overall project health.
Q: Can KPIs be adjusted during a project?
Yes, KPIs can be adjusted during a project. Regular evaluation and reassessment of selected KPIs are crucial. As the project progresses, new insights may emerge, and priorities may change. Adjusting KPIs allows project managers to stay aligned with goals and capture pertinent performance indicators. However, it’s important to maintain consistency and avoid frequent changes that can disrupt measurement and analysis.
Q: How often should project managers review and update KPIs?
The frequency of reviewing and updating KPIs depends on project duration, complexity, and the pace of change within the project environment. As a general guideline, project managers should conduct regular reviews, typically on a monthly or quarterly basis. These periodic reviews enable tracking progress, identifying trends, and making informed decisions based on performance data. If significant changes occur within the project, more frequent reviews and updates may be necessary to ensure KPIs remain relevant and aligned with project objectives.
Q: Which tools or software can assist in tracking and monitoring project KPIs?
Various tools and software solutions can assist in tracking and monitoring project KPIs. Popular options include project management software such as Microsoft Project, Asana, and Trello, which offer features for setting and tracking project KPIs along with other project management functionalities. Business intelligence tools like Tableau, Power BI, and QlikView provide robust data visualization capabilities, allowing the creation of interactive dashboards and reports for KPI tracking. Spreadsheets like Microsoft Excel and Google Sheets can be used to create customized KPI tracking templates and perform data analysis. Additionally, enterprise-level performance management systems such as Oracle Primavera, SAP SuccessFactors, and Workday offer comprehensive features for tracking and reporting KPIs.

