What is HubSpot Reporting?
HubSpot reporting is a key marketing and sales tool that can provide you with clear insights into how your business is performing across many metrics. The process of improving your overall reports begins by evaluating what exactly you’re doing well today and need to focus on in the future, leading to better results in both marketing and sales.
Marketing and sales reports are a way to measure how your marketing and sales efforts interact with the market. There is a variety of ways for marketers to make sense of their data, including charts, graphs, and tables. This guide only focuses on HubSpot reporting tools; other companies also offer similar analytics tools that can be used in conjunction with HubSpot.
The basics of HubSpot reporting include a marketing dashboard and reports that marketers can empower their teams with. Adding other tools to the mix, like an analytics platform or CRM software, will help turn your reports into actionable data. Remembering the benefits & limitations of using native HubSpot reporting when choosing additional tools for your report setup will ensure that you get the most out of all your data-gathering efforts!
How Can HubSpot Reporting Be Used To Build Better Reports For Your Department?
HubSpot reporting is a great way to track and analyze your data. But it can also be used to create better reports for your department. In this blog, you’ll learn how to use HubSpot to build better reports that are tailored to your specific needs. You’ll learn how to create various charts that can be used to visualize data, as well as how to layout your report for maximum readability. And you’ll learn how to incorporate your branding into the design of the report.
But that’s not all! You’ll also learn about HubSpot’s focus on taking action after the use of data. “Great metrics lead to great insights, and that leads to actions and results.” By using HubSpot reporting tools, you can help improve your business’s bottom line by taking action on the insights gleaned from your data.

What Are The HubSpot Reporting Features And Tools That You Can Use To Create Dashboards?
There are many great features and tools that you can use to create dashboards. For example, by using pre-made templates, you can easily create custom dashboards with ease. Additionally, if you only want to see certain information on your dashboard, you can clear the checkboxes for the items you don’t want to see. You can also customize your theme, reports, and actions to create a unique dashboard that meets your specific needs.
If you already have a dashboard created, select New Dashboard in order to create another one. This will allow you to have multiple dashboards which can be helpful if you’re working on multiple projects or departments simultaneously. To view and edit a dashboard, select View and Edit. From there, Super Admins can set the owner of the dashboard as Private if they are also the owner of it.
Select View only if all users who need access should be able to view the dashboard without being able to edit it themselves. This is perfect if you want other team members or managers within your company to be able to quickly get an overview of what’s going on but don’t want them messing with any of your carefully crafted reports!
Finally, select Edit if there are specific team members who need to be able to view and edit the dashboard. You can then select the users and teams who will have this access.
What Are The Differences Between Dashboards And Reports?
Reports and dashboards are both ways of visualizing data, but there are some key differences between them. Reports show specific information, whereas dashboards contain either a single report or multiple reports that are of similar nature or highlighting the important information. Additionally, reports can only be edited by users with the appropriate permissions, whereas dashboards can be edited by anyone who has access to them. Dashboards can also be assigned to specific users or teams, while reports cannot. Finally, dashboards are interactive and user-friendly, whereas reports are not.
Is The HubSpot Reporting Platform Easy To Use?
Yes, HubSpot’s reporting platform is easy to use. In fact, it was designed with marketers in mind who don’t need to get too granular with their data. With the HubSpot Reporting Add-on, you gain access to central dashboards which bring all of your marketing and sales reports together in one place. The user interface is intuitive and convenient, making it easy for marketers to create reports without any additional tools or integrations. Plus, HubSpot can function as a standalone platform–users can create and customize dashboards and reports without any other tools or integrations.
Are There Any Free Data Dashboards Available?
Yes, there are plenty of free data dashboards available on the internet. However, it can be difficult to find one that is customizable and easy to use. The HubSpot Sales Dashboard is a great example of a data dashboard that is both free and easy to navigate. It lets you see how much revenue each salesperson generates, with key metrics right in the centre of the screen. You can also compare close rates to those of previous periods or industry benchmarks. This dashboard is a great example of seeing where you make the most sales and what products customers purchase the most.
How Do I Create A Custom Dashboard?
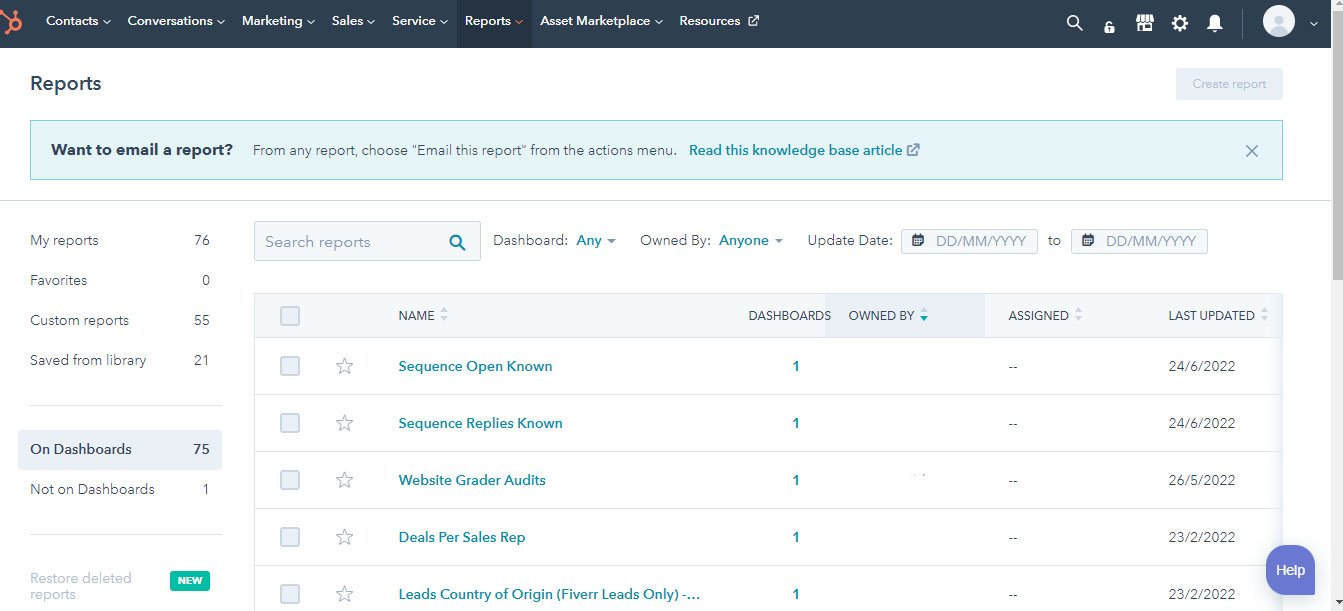
- To create a custom dashboard, navigate to Reports > Dashboards.
- Customize your dashboard by selecting the desired options and colours.
- Share and export dashboards to make them available for use with other people or organizations (Professional and Enterprise only).
- To create a custom dashboard, select one of the pre-made templates or create a blank dashboard.
- To remove reports from your dashboard, clear the checkboxes next to them in the right panel.
- The default access for private dashboards is “Private to the owner.”
- The user who created the dashboard is considered a Super Admin and can only select “Customize” for this option.
- The user who created the dashboard has to be an Enterprise HubSpot account, which allows them to customize it for specific users or teams in their account.
What Are The Best Dashboard Tools?
There are many different types of dashboard tools out there, and it can be tough to decide which one is the best for your team. However, there are a few key factors to keep in mind when choosing a tool:
- Dashboards should be easy to use and understand. The data presented on them should be clear and concise, so that team members can make decisions quickly and easily.
- Dashboards should be customizable so that they include only the data that’s most relevant for each individual or group of people.
- Dashboards should offer end-to-end reporting so that marketing can see how their posts are performing and identify what’s working well (or not).
- A unified goal is important for sales and marketing teams – they need to have a common objective in order to work together effectively.
- Dashboard tools must allow for both marketing and sales teams to track progress, as this will help them identify where they need improvement.
HubSpot is an excellent tool for creating reports because it offers all of these features and more. It’s easy to use, customizable, offers end-to-end reporting, allows for tracking progress, and has a unified goal between sales and marketing teams.
What Is The Difference Between A Report And A Dashboard?
A report is usually a single piece of information, whereas a dashboard can contain multiple reports. Reports are generally used to view and interact with data. Dashboards, on the other hand, are designed for specific purposes and typically contain more corelating data sets.
Sales and marketing teams use dashboards to monitor their performance and track progress towards specific goals. A good dashboard will provide an at-a-glance overview of all the key metrics you need to know to make informed decisions.
HubSpot offers both reports and dashboards as part of its reporting suite. Reports and dashboards also allow marketers to track metrics across different metrics in a single report, while the sales & marketing dashboard highlights important metrics on one screen.
Do Reports And Dashboards Serve The Same Purpose?
There is a lot of confusion about the purpose of reports and dashboards. Do they both serve the same function? And if not, what is the difference between them?
In short, reports are used to track performance over time, whereas dashboards are used to track current progress against specific goals or objectives. Reports provide historical data that can help you make decisions about future actions, while dashboards give you an up-to-the-minute view of how your team is performing right now.
Reports are typically used for long-term analysis and decision making, while dashboards are more suited for real-time monitoring. However, this isn’t always the case – some organizations use reports as live dashboards, and vice versa. It really depends on your individual needs and preferences.
What Is Marketing & Sales Reporting?
Sales and marketing reporting is the process of measuring progress, showing value, and identifying actionable steps. The goal of this type of reporting is to help businesses better understand why their marketing efforts are successful. This understanding can be gained by looking at metrics such as return on investment (ROI).
Dashboards are typically split up into sections, with each section focusing on different metrics that are important to a given business. To create accurate reports, it’s essential to have all the data in one place. HubSpot provides this capability through its sales and marketing reporting tools. With HubSpot, users can track performance across channels and mediums to see what is working well and what needs improvement. Additionally, HubSpot offers a number of features for data visualization and segmentation–all in one place! This makes it really easy for marketers, salespeople, and everyone else involved in the process to get a clear picture of how well their efforts are going.
A sales and marketing report includes key information such as revenue, top-selling products/services, etc. It also includes data on things like the average number of leads that come into an organization through a given channel or medium. By having access to this type of information, businesses can make informed decisions about where to allocate their resources to improve their marketing and sales efforts.
The Basics Of HubSpot Reporting
1. HubSpot reports
There is a variety of HubSpot reports that businesses can view, depending on their needs. The most commonly viewed type of HubSpot report is as part of a dashboard. A dashboard is often made up of different types of reports, which gives business owners a broad overview of their company’s performance.
If you’re looking for more detailed information about your company’s marketing and sales metrics, the HubSpot reporting add-on is a package that provides businesses with company-wide metrics. This tool allows you to generate up to 200 dashboards, each of which can have 2,000 reports.
2. HubSpot analytics tools
HubSpot offers a variety of different analytics tools that let you drill into your data a bit further. The reports tool allows you to compile and organize the data that you’ve previously collected. This can be really helpful if you want to see how, for example, your website is performing under a host of different metrics. The website analytics tool provides you with data on how your website is performing under a host of different metrics, such as conversion rates, new customers, and page views per session. You can also use it to analyze blog posts, landing pages, or website pages.
HubSpot also offers a way to connect your Facebook and LinkedIn accounts so that you can analyze the performance of your ads. That way, you’ll be able to view reports like impressions, clicks, and conversion rates on web pages in relation to time ranges. Finally, campaign analytics helps marketers measure the success of their campaigns. HubSpot uses a variety of tools to help marketers be more productive – including campaign analytics and marketing automation features – which is why it’s important for them to have access to this kind of information about their campaigns’ successes and failures.
3. HubSpot dashboards
HubSpot offers a default reporting dashboard that provides an overview of ten different reports. This is perfect for marketing, sales and service metrics. The default dashboard contains up to ten reports focused on the most common marketing metrics. HubSpot also offers ten different reports, each with its own layout and content. Each report has its own default layout to make it easy for new users to pick one that suits them. The reporting structure is simple but powerful, while customizable dashboards allow teams the ability to choose which data they want to be sent to them in real-time.

The Benefits and Limitations of Native HubSpot Reporting
Benefits of reporting in HubSpot
HubSpot offers a comprehensive sales, support, and marketing platform. It’s easy to work with for marketers who don’t need granular data. With the addition of the HubSpot Reporting Add-on, marketers can now access Marketing and Sales data in one place via central dashboards. It’s convenient to create reports without having to use any additional tools or integrations. HubSpot integrates with most tools and systems, making it easy to track customer data across the entire journey. It has a user-friendly interface that makes it easy to create reports for marketers who don’t need granular data.
Limitations of reporting in HubSpot
Although HubSpot offers some great reporting features, there are also some limitations to be aware of:
HubSpot does not support importing data from other sources, so if you want to analyze data from different channels or marketing tools, you’ll need to do some extra work.
The user interface is limited and can’t be changed manually – this can make it difficult to create reports that fit your specific needs.
Only data already in HubSpot can be used with reports, making it difficult to create a report covering all portals at once. If you have multiple accounts or portals, you’ll need to create separate reports for each one.
You can’t bring data from other marketing tools into HubSpot without some work – this makes it hard to get a complete picture of your marketing efforts in one place.
The reporting features of HubSpot make it hard to analyze data in-depth – many options are available only through the API, which requires coding knowledge.
You’re limited by a user interface that is limiting when it comes to customization and visualization of reports. This can make it difficult to get an accurate understanding of your marketing performance.

How Marketers Can Superpower Their HubSpot Reporting
HubSpot blends the marketing data with other reporting tools
HubSpot does not have every tool a marketer may need for reporting. A third-party tool is often required to report on marketing activities across multiple tools or platforms. Databox is a useful reporting tool that integrates data from HubSpot and other different marketing and sales platforms. The analytics dashboard in Databox helps present all of your company’s essential KPIs in one location and across many devices.
UDS’s team uses HubSpot to manage multiple aspects of their business – including sales and marketing data in one platform by using the Supermetrics HubSpot Connector.
HubSpot builds platforms that make it easier to pull data from sources, like social media engagement or customer success metrics, into one place so marketers can get a holistic view of their performance.
Analyse HubSpot data using other marketing tools
Many marketers use spreadsheets to analyze their HubSpot data. Spreadsheets enable you to use mathematical formulas and functions, which can be helpful in analyzing your data. The main problem with using spreadsheets is the time it takes to transfer data into them manually. This process can be quite tedious and time-consuming.
HubSpot CRM and HubSpot Marketing can be linked as two separate sources. The company’s goals can be easily set up and monitored with Databox. This can assist organisations in achieving their goals and delivering data-driven marketing and sales efforts. Databox helps you view key metrics over time and compare them to previous periods. Assess the impact your website has on lead generation and customer conversion.
Data can only be exported into a spreadsheet, with the help of Databox. Databox connects to a variety of different applications and allows you to export your data into a customizable spreadsheet. This can be a helpful tool for creating comprehensive reports. Databox has an unmatched capacity for producing reports that are both visually appealing and valuable for analysis. The time saved by the Databox report production has allowed us to devote more time to analysis and content preparation.
Create multi-portal HubSpot reports
Marketers need to go into each of the HubSpot portals to create a multi-portal report. However, this process can be time-consuming and it’s easy to miss important data.
A better solution is to use Supermetrics. This tool allows marketers to pull data from as many portals as they want, which saves time and increases accuracy.
Creating a reporting dashboard is easy with Google Data Studio. Supermetrics provides a template so it can be customized based on your business purpose. Add a new dashboard, name it anything you want, and start pulling in data from all of your HubSpot portals!
How To Automate Your HubSpot Reporting
Reporting can be a time-consuming process, and it’s easy for metrics to be botched if they’re not done correctly. There are ways to automate your reporting so that it’s more accurate and efficient.
Before you’ll be ready to automate your reports, build a template with a reporting tool like Google Data Studio or Excel. This will help you format your data in a way that makes it easier to read and understand. The marketing team can use HubSpot to automate important tasks like emailing customers or creating new leads, but they may also want to use Databox to “superpower” their HubSpot reporting with a customizable design and instant updates based on the schedule they choose.
Databox allows marketers to integrate multiple data sources into a comprehensive report, which gives them a more complete picture of their business performance. They can also use Databox’s custom metrics available for marketers that HubSpot does not provide. This information can help them track their progress over time and optimize their marketing strategy accordingly.
How Marketing Agencies Can Improve Their HubSpot Client Reporting
Marketing agencies have been using less robust tools to report, with the goal of driving more automation. However, this can lead to decreased insights and results for their clients.
Achieving better insights and results for clients means marketing agencies need to use more robust tools to superpower their HubSpot reporting. This includes using a tool like HubSpot’s Marketing Hub in addition to Supermetrics, which allows marketers to automate tedious tasks.
By doing so, agencies are able to provide better insights and demonstrate the value of their marketing work – not only through increased efficiency but also by showing business impact (e.g., conversion rates).
How To Create A HubSpot Reporting Dashboard
Marketing dashboard best practices
There are four essential rules to follow when creating a marketing dashboard:
- Decide on your goals: What do you want to measure and track? What information will help you make better decisions about your marketing efforts?
- Decide which metrics to include in your dashboard: Not all data is relevant or useful for dashboards, so choose the most important metrics that will give you a snapshot of how your marketing is performing.
- Have a home for your dashboard: This can be either on your computer or as an app on your phone, but make sure it’s easy to access and update regularly.
- Make it visually appealing: A well-designed dashboard is more likely to be used and updated regularly. Think about what type of charts and graphs will best represent the data, and use colours and fonts that are easy on the eyes.
In addition, it’s important to consider including both marketing and sales data in order to get a complete view of customer lifecycle progression. And finally, make sure each graph, chart, or table can be directly linked to a step that can be taken to improve performance so that the dashboard is actionable.
HubSpot reporting templates
Pre-built reporting templates and dashboards make the process of creating a report much easier. HubSpot provides pre-built templates for marketers which are helpful for creating simple reports. HubSpot reporting templates can be found here. Reporting templates are easy to use, provide immediate insight, and can be customized for specific needs. Templates for reporting help you get a broad overview of your performance quickly. These templates allow a person to pull data from HubSpot and create reports. These templates are free for up to five users and two reports per month.
How To Turn Your HubSpot Reports Into Action
1. Strategise
Once you have your HubSpot data, the next step is to carefully plan your strategy for using it. You need to think about what you want to learn from the data, and how you can use that information to improve your business.
After you have a plan in place, it’s time to create a model which will help determine what you can do with the data. This model should answer questions such as: What are our goals? What are our current problems? And how can HubSpot data help us address these issues?
Once you have a model in place, it’s time to turn your analysis into action. Find a hypothesis that could help address the problem at hand, and then develop an action plan which will help put that hypothesis into practice.
2. Be agile
To be successful in the competitive marketplace, companies are turning to agile marketing. Agile marketing allows for constant analysis of data and reacting to findings. This approach helps shorten the time it takes to deploy new campaigns and get results.
A cyclical pattern of monitoring, analyzing and acting on your data will give you the most out of HubSpot reports. Marketing teams adopt an agile marketing model to get more value from their efforts and speed up deployments with shorter sprints. In this way, they can constantly analyze data and act on findings.
Measurement of success after each sprint helps determine what worked, what didn’t, and what can be done next time in order to achieve even better results. The goal of the report is to determine how effective your marketing channels are so that you can allocate resources accordingly. Targeting specific marketing channels with different tests will help you pinpoint the problem areas for each channel and create solutions to increase lead conversions.
It’s important to look at your existing analytics tools and analyze the data from them so that you understand which content marketing strategy is working best for you at any given moment. Once you’ve determined which content marketing strategy is working, it’s time set a goal for the next period of time, such as increasing MRR or reaching a certain number of paying customers. And finally, the agile marketing model encourages teams to adapt their content marketing strategies based on results.
Choosing The Right Additional HubSpot Reporting Tools
1. Map out your needs
When it comes to marketing, data is key. You need to know what’s working and what isn’t so you can make informed decisions about where to allocate your resources. But with so many different tools out there, which should you use?
Well, that depends on what your specific marketing goals are. If you’re looking for a comprehensive view of all your marketing activity, then a tool like Google Analytics is a good place to start. It offers insights into website traffic, conversion rates, and more.
If you’re interested in measuring the performance of your social media campaigns, then something like Sprout Social would be a better choice. It provides detailed reports on things like Twitter followers and engagement rates.
And if you’re focused mainly on generating leads and sales, HubSpot is hard to beat. It offers a powerful analysis of sales and conversion funnel stages.
2. Consider your existing tools
When you’re looking to add more reporting capabilities to HubSpot, it’s important to consider your existing tools. In particular, think about the best way to visualize the data before you start building a report.
There are a number of third-party tools that can boost your reporting capabilities with HubSpot. The Custom Report builder offers different types of graphs, which can be helpful when trying to understand your data. And if you need extra help getting started, HubSpot Academy offers free access to all its courses – including this one on using additional reporting tools in HubSpot. So whether you’re just starting out or looking for ways to take your skills up a notch, they’ve got you covered!
3. Check for integrations
When you’re looking for HubSpot reporting tools, it’s important to check for integrations with your key platforms and tools. Most good reporting tools will integrate with HubSpot, as well as other popular platforms like Google Ads and Google Analytics. However, there are some great options that don’t have a direct integration with HubSpot. ChurnZero is a customer success platform that tracks how your customers use your product, and Supermetrics is a great reporting automation tool for pulling metrics into a single, accessible location. If you’re using other online advertising platforms like Google Ads or Google Analytics, make sure the reporting tool you choose integrates with those services. And finally, if you want to track user actions on your website – like how many people are visiting certain pages or what the conversion rate is – Hotjar is a great option.
Using HubSpot Reports
1. In-tool reports
HubSpot offers in-tool reports to help businesses measure their success. You can find reports on common metrics available in the tools hub, such as impressions, conversions and more. The dashboard of commonly asked questions related to your tool usage can be found under the ‘Reports’ tab.
You can also find pre-built reports to help you measure your website’s success. HubSpot subscriptions come with analytics tools that provide information about website, sales, service and other metrics. Reports can be shared with your users via email or Slack. They can also be scheduled on a recurring basis or sent out as one-off emails.
2.HubSpot analytics tools
As a business owner, you want to be able to track the success of your marketing initiatives. HubSpot offers traffic analytics tools that allow you to dig a bit deeper into the data. You can use HubSpot to analyze landing pages, blog posts or any other type of page. You can filter all that data by date range, allowing you to see the impact of any changes made.
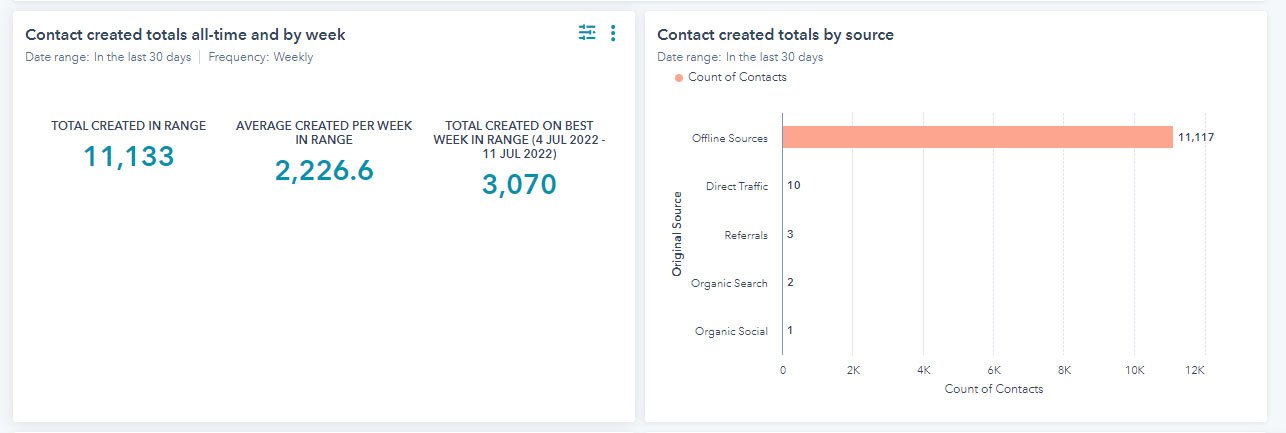
Databox and HubSpot provide ways to track the most important Landing Page metrics in order to understand what creates new contacts for your business. Additionally, with HubSpot, you can connect your social media accounts to create reports. These reports will help you measure performance in five areas: sessions, influenced deals, influenced contacts, new contacts, and revenue.
Campaign analytics are an easy way to measure the effectiveness of campaigns created with HubSpot. And if you need even more detailed information about how customers are performing based on different metrics of the ads they view – such as click-through rates (CTRs) and conversion rates – then AdWords integration is perfect for you!
Top Features Of HubSpot Reporting Dashboard
1. Sales reports
Sales Reports are an important part of understanding how your business is performing. The “HubSpot Reporting Dashboard” offers insights about abandoned carts and other important data for conversions. Additionally, this report can help you analyze the performance of your sales.
There are reports available in the HubSpot Reporting Library which may be of most use to your business. The key is knowing how useful these reports will turn out to be for your business and what information they contain that might be helpful for strategic decisions and improved sales processes.
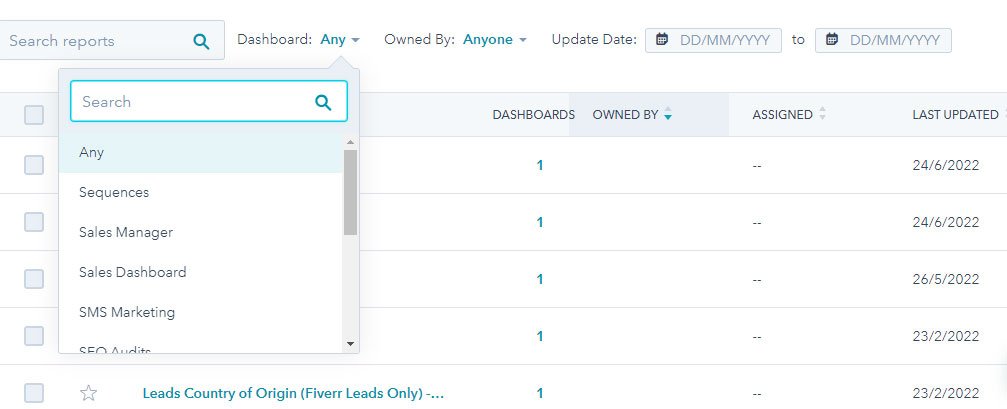
For example, there are a variety of reports available to help track sales productivity, website analytics, and contact behaviour. Additionally, HubSpot Reporting Dashboards make it easy to filter by topic.
2. Marketing reports
HubSpot Marketing Reports are fully customisable and allow you to measure your marketing activities against a general idea of how well they’re doing. They have metrics for the top landing pages, conversion rates, traffic patterns on different types of web content, etc.
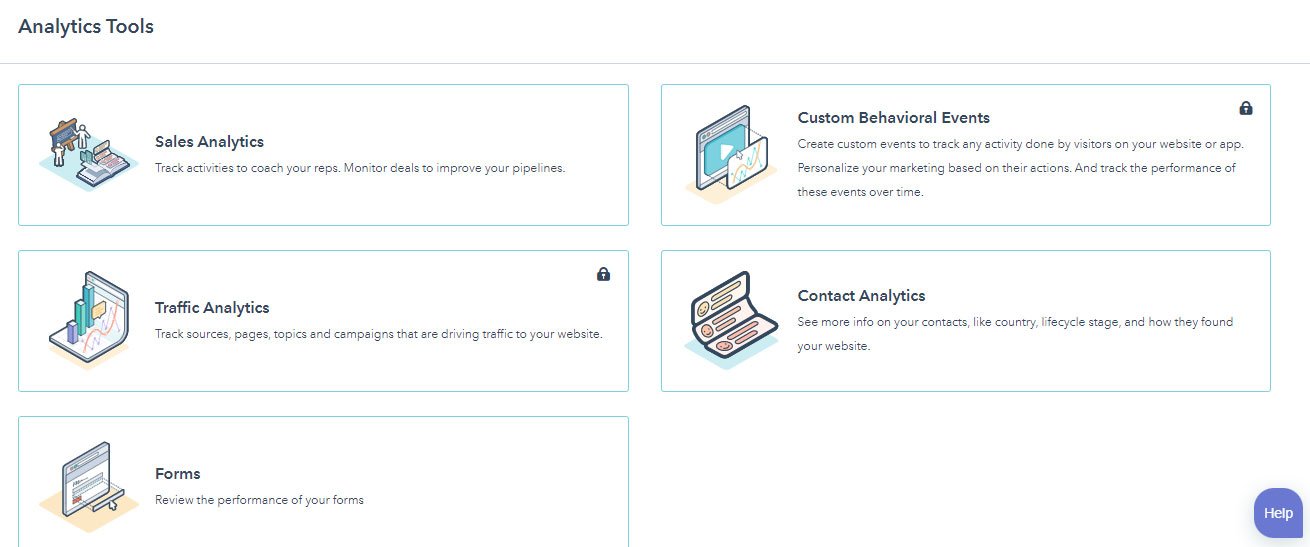
All HubSpot Reporting Dashboards come standard with the following reports: Traffic Analytics, Sales Analytics, and Custom Behavioral Events. Additional reports (like the ones mentioned above) are available in the Enterprise or Professional Edition packages.
HubSpot Reporting Dashboards also allow users to create custom reports by using the report builder. This report builder allows users to build custom reports and measure conversion rates. Marketers can use this information to measure the impact of each asset and track revenue by source and asset type.
3. Performance assessment
The HubSpot dashboard is an excellent tool for assessing productivity over time. It allows you to compare the number of calls, emails, notes, meetings and tasks your team has logged over a selected time frame. This is beneficial for understanding how different marketing and sales activities are impacting productivity.
4. Productivity assessment
Using HubSpot’s reporting dashboard, you can assess the productivity of your eCommerce inbound marketing and inbound sales. The report tells you how many calls, emails, notes, tasks and meetings your team has logged in the selected period. This is a great tool for studying productivity. You can also use it to examine the effectiveness of your marketing efforts. It tells you how many calls, emails, notes, tasks and meetings your team has logged in the selected period.
5. Deal forecasting
HubSpot Reporting Dashboards is a tool that allows users to forecast revenue in an easy-to-read format. It is great for understanding how sales are distributed across deals, and for predicting trends and future opportunities based on existing data. The Deal Closed Totals vs. Goal report helps users see how much of the goal has been achieved, as well as specific unit sales totals by a sales representative. HubSpot Dashboards also help determine if each rep is hitting their revenue goals. It helps them compare the individual’s success against the team’s success, with the goal of improving overall performance.
6. Deals closed vs. goal
The reporting dashboard will show you the number of deals your team closed, and compare that with their goal. The revenue from closed deals is plotted against your team’s quote. The Goal report breaks down deals by each individual sales rep and helps determine if they are hitting their revenue goals compared to the overall goal. The Goal report can be split up into dates, allowing for a more detailed view of individual deals. This dashboard is customisable, giving reps the ability to tailor it for their needs and specific needs.
7. Recent activity feature
The activity reporting feature allows for easier tracking of recent events. You can stay up-to-date with the most recent activity on the dashboard and marketing matrices. This is a great way to quickly assess what’s been going on in your HubSpot account and determine what actions need to be taken next.
HubSpot features a lot of sales reports, but each team is different and you may need something more specific. That’s why HubSpot allows for customisation depending on the unique needs of your business. You can create custom reports based on the data that matters most to you and your team.
The Basics Of HubSpot Reporting
HubSpot reports
The HubSpot Reporting Add-On is a tool that combines all reports into one interface. It costs $200 per month and provides 10 days of a free trial. With the add-on, users can create custom reports by using the advanced custom report builder. This builder allows users to create reports from multiple data sources within their accounts. The Custom Report Builder is only available for Professional or Enterprise customers. However, the Academy lesson on building custom reports in HubSpot is only available for Professional and Enterprise customers.
HubSpot analytics tools
HubSpot can track website traffic and provide more data analysis tools. Website Analytics is for detailed data analysis of website traffic. The Traffic Analytics tool provides a bird’s-eye view of how your site is performing HubSpot is a tool for tracking website statistics. In addition to traditional metrics, HubSpot tracks conversion rates and page views with this tool. HubSpot offers a tool that allows you to analyze websites and see the impact of changes made. HubSpot is an all-in-one analytics software, which includes an online dashboard “Databox” which helps track metrics on landing pages HubSpot Ad Analytics connects with social media accounts to create reports that show ad performance. HubSpot Ad Dashboards display metrics on engagements, CTR, and the number of contacts by lifecycle stage. The “DataBox” is a new feature in Databox which allows users to visualize the performance of different lifecycle stages in one place.
HubSpot dashboards
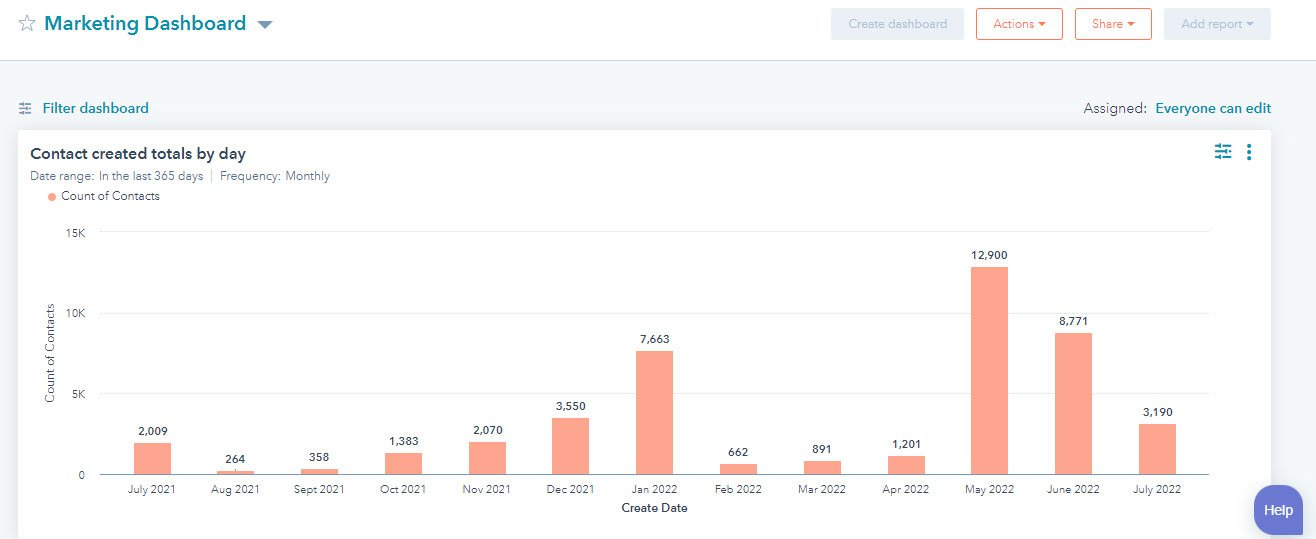
HubSpot dashboards provide a wide range of reports to help with performance. The default marketing dashboard, for example, focuses on email, conversion rates, and page views. The default service dashboard includes a variety of reports that can be customized by the user. For example, you might want to add or remove a report from the Service Dashboard depending on your team’s needs.
Dashboards are used to group different reports together so they can easily be found. HubSpot dashboards can be scheduled to send at recurring intervals. This is a great way to make sure your team always has access to the most recent data. Additionally, content from outside of HubSpot can be embedded in a dashboard and pulled in by users on the fly. This is a great way to get insights from other sources into your HubSpot account without having to leave the platform. Finally, create and manage your dashboards according to organizational needs and share them with others within or outside of your company who have access to HubSpot Reporting.

Conclusion
Using HubSpot reporting tools can help you better understand your marketing performance and optimise your campaigns. If you want to know more about HubSpot Reporting, we recommend you partner with Ubique Digital Solutions. UDS is your all-in-one Diamond HubSpot Agency that can help you with its amazing marketing services and solutions. Contact UDS now!