


Google Data Studio vs DataBox
Effective data visualization is crucial for businesses to gain insights and make informed decisions. Data visualization tools simplify the process of transforming complex data into visually appealing and easily understandable charts, graphs, and dashboards. Among the various options available, Databox and Google Data Studio are two popular tools worth considering.
Databox is a powerful data visualization platform that enables users to connect and analyze data from various sources. It offers a range of features and capabilities to create interactive dashboards, track key metrics, and collaborate with team members. On the other hand, Google Data Studio is a free tool by Google that allows users to create and share customizable reports and visualizations using data from multiple sources.
| Category | Databox | Google Data Studio |
| Data Connectors and | Wide range of integrations with popular platforms such as Google Analytics, HubSpot, Facebook Ads, etc. | Integrations Integrates with Google products and other data sources through connectors |
| Pricing and Plans | Paid plans are available with tiered pricing based on features, data sources, and users | Free to use, with additional costs for certain advanced features and integrations |
| Customization Options | Users can customize dashboards with various visualization options, chart types, and widgets | Users can leverage a wide variety of visualization options and chart types |
| Collaboration and Sharing Features | Collaboration and sharing features for team collaboration and sharing insights with stakeholders | Collaboration and sharing features for sharing reports with team members and clients |
| Ease of Use and User Interface | User-friendly interface with intuitive navigation | User-friendly interface with a familiar Google-style design |
| Learning Curve | Relatively low learning curve | Relatively low learning curve, especially for users familiar with other Google tools |
| Integrations and Data Sources | Wide range of integrations and supports API access for custom data sources | Integrates with Google products and offers connectors for non-Google data sources |
| Advanced Functionality and | Offers automated alerts, goal tracking, and data transformations and calculations | CustomizationOffers interactive reporting, data blending, and advanced calculations |
| Performance and Scalability | Handles large datasets, real-time data processing, and provides fast response times and loading speeds | Handles large datasets, provides fast response times, and efficient data retrieval and visualization |
| Pros | Wide range of data connectors and integrations, pre-built templates and dashboards, customization options, collaboration and sharing features | Free to use, integration with Google products, simple and intuitive interface |
| Cons | Pricing can be a concern for users with limited budgets, learning curve for advanced features and calculations | Limited advanced functionality compared to paid tools, some advanced features may require additional costs or technical expertise |
Features and Capabilities
Databox

Databox provides a wide range of features and capabilities that make it a versatile data visualization tool. It offers seamless data connectors and integrations with popular platforms such as Google Analytics, HubSpot, Facebook Ads, and more. This allows users to consolidate data from multiple sources into a single dashboard, providing a holistic view of their business metrics. Additionally, Databox offers pre-built templates and dashboards, saving users time and effort in creating visualizations from scratch. Users can also customize their dashboards to suit their specific needs, choosing from a variety of visualization options, chart types, and widgets. Collaboration and sharing features allow teams to collaborate on dashboards, set up automated alerts and notifications, and share insights with stakeholders.
Google Data Studio
Google Data Studio also offers a range of features and capabilities to create visually appealing reports and visualizations. It provides data connectors and integrations with popular Google products like Google Analytics, Google Ads, and Google Sheets, as well as other data sources through connectors like BigQuery and MySQL. Users can leverage a wide variety of visualization options and chart types to present data in meaningful ways. Data filtering and segmentation capabilities enable users to analyze specific subsets of data. Collaboration and sharing features allow users to share reports with team members and clients, granting them access to real-time data and interactive features.
Ease of Use and User Interface

Databox
Databox prides itself on its user-friendly interface, designed to simplify the process of creating and modifying dashboards. The intuitive interface makes it easy for users to navigate through different sections and modules. The learning curve is relatively low, allowing users to quickly understand how to connect data sources, build visualizations, and set up performance tracking. Creating and modifying dashboard is a seamless process with drag-and-drop functionality and a library of pre-built widgets that can be easily customized.
Google Data Studio
Google Data Studio also offers a user-friendly interface with a familiar Google-style design. Users already familiar with Google’s suite of products will find it easy to navigate and locate the necessary features. The learning curve is relatively low, especially for users who have experience with other Google tools. Creating and modifying reports and visualizations is straightforward, with a simple drag-and-drop interface that allows users to arrange and customize components with ease.
Pricing and Plans
Databox
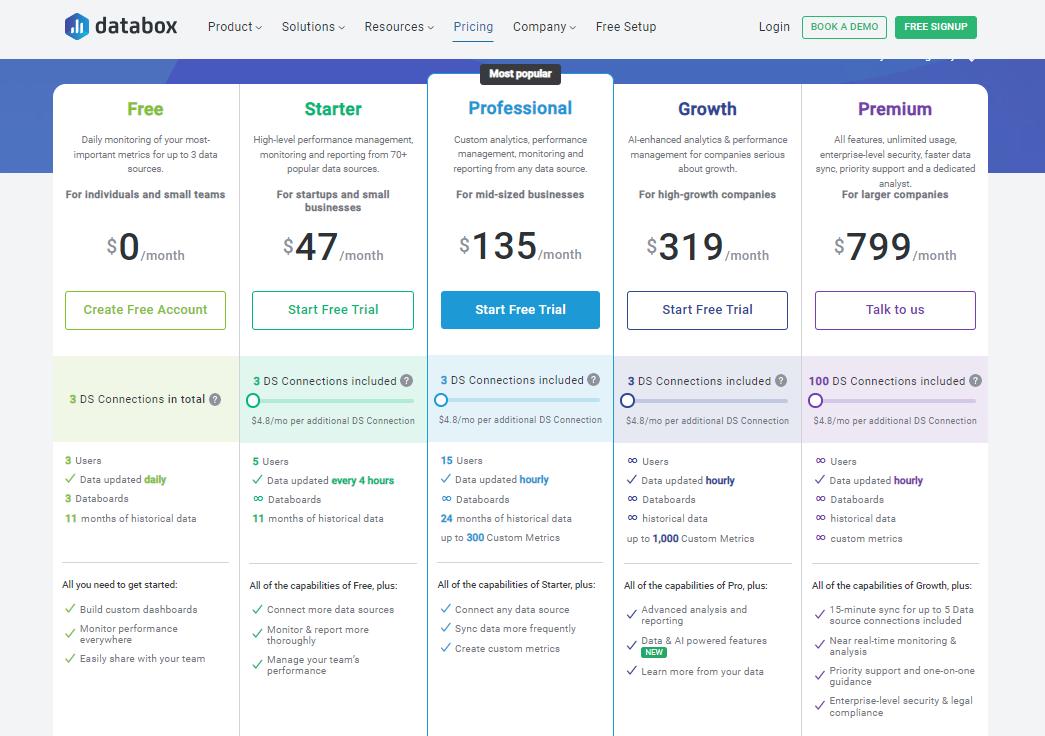
Databox offers different pricing plans to cater to various user needs. The plans include a free tier with limited features and data sources, as well as paid plans that offer more advanced features, integrations, and data source limits. The paid plans are available on a monthly or annual subscription basis, with tiered pricing based on the number of data sources and users. The pricing structure ensures scalability, allowing users to choose a plan that aligns with their requirements and budget.
Google Data Studio
Google Data Studio, on the other hand, is free to use for individuals and businesses alike. As a part of the Google Marketing Platform, it offers a comprehensive set of features without any cost. This makes it an attractive option for users who are just starting with data visualization or have limited budgets. However, it’s important to note that certain advanced features and integrations may require additional costs, such as Google BigQuery for large-scale data analysis.
Integrations and Data Sources

Databox
Databox supports a wide range of integrations with popular data sources, including Google Analytics, Salesforce, HubSpot, Facebook Ads, Instagram, and more. These integrations allow users to connect their data sources seamlessly and access real-time metrics in their dashboards. Databox also provides API access, enabling users to integrate custom data sources if needed.
Google Data Studio
Google Data Studio integrates with various Google products, such as Google Analytics, Google Ads, Google Sheets, YouTube, and more. Additionally, it offers connectors to non-Google data sources like MySQL, BigQuery, and Salesforce. This allows users to bring in data from multiple platforms and create comprehensive visualizations. However, compared to Databox, the range of integrations and data sources supported by Google Data Studio is slightly more limited.
Advanced Functionality and Customization

Databox
Databox offer advanced functionality to enhance data visualization and analysis. Automated alerts and notifications can be set up to monitor key metrics and receive updates in real time. Goal tracking and performance monitoring features allow users to set targets and track progress towards those goals. Databox also provides data transformations and calculations, enabling users to perform calculations and create custom metrics directly within the platform.
Google Data Studio
Google Data Studio offers advanced data visualization options, including the ability to create interactive and dynamic reports. Users can add interactive elements such as filters, date range controls, and drill-down functionality. The platform supports data blending, which allows users to combine data from multiple sources for more comprehensive analysis. Advanced calculations and formulas can be applied to create custom metrics and dimensions.
Performance and Scalability

Databox
Databox is known for its performance and scalability. It is capable of handling large datasets and processing data in real time, ensuring that the visualizations and metrics are always up to date. Databox provides fast response times and loading speeds, allowing users to access and analyze their data without significant delays.
Google Data Studio
Google Data Studio leverages the power of Google’s infrastructure, ensuring high performance and scalability. It can handle large datasets efficiently and provides fast response times for data retrieval and visualization. The loading speed of reports and visualizations is generally quick, allowing users to access and share insights without delays.
Pros and Cons

Databox
Pros
- Wide range of data connectors and integrations
- Pre-built templates and dashboards for quick setup
- Customization options to tailor visualizations to specific needs
- Collaboration and sharing features for team collaboration
Cons
- Pricing can be a concern for users with limited budgets
- Learning curve for advanced features and calculations
Google Data Studio

Pros
- Free to use, making it accessible for individuals and small businesses
- Integration with other Google products and data sources
- Simple and intuitive interface for easy report creation
Cons
- Limited advanced functionality compared to paid tools
- Some advanced features may require additional costs or technical expertise
Conclusion

In conclusion, both Databox and Google Data Studio are powerful data visualization tools with their own strengths and capabilities. Databox offers a wide range of features, advanced functionality, and extensive data integrations, making it suitable for businesses that require comprehensive analytics and reporting. On the other hand, Google Data Studio provides a free and user-friendly solution, ideal for individuals and small businesses with limited budgets. The choice between the two depends on specific use cases, budget considerations, and the level of customization and advanced features required.
If you’re looking to boost your business’s data visualization capabilities and drive success, partnering with a trusted digital solutions provider like Ubique Digital Solutions can be a game-changer. Ubique Digital Solutions specializes in helping businesses harness the power of data by implementing and optimizing data visualization tools like Databox and Google Data Studio. Their experienced team can provide expert guidance, implementation support, and customized solutions tailored to your business needs. Don’t miss out on the opportunity to take your data-driven decision-making to the next level. Contact UDS today and embark on your journey towards data-driven success.
FAQs
Q: Which tool is better for small businesses with limited budgets?
For small businesses with limited budgets, Google Data Studio is a more suitable option. It is free to use and offers a comprehensive set of features that allow businesses to create visually appealing reports and visualizations. While Databox provides more advanced functionality, it comes with a pricing structure that may not be feasible for businesses with limited resources.
Q: Can I use both tools together for my data visualization needs?
Yes, it is possible to use both Databox and Google Data Studio together. Since Databox and Google Data Studio support various data sources and have different features, they can complement each other. Users can leverage the strengths of each tool and integrate data from multiple sources into their visualizations. For example, Databox can be used for in-depth analytics and performance tracking, while Google Data Studio can be used for creating visually appealing reports and sharing insights with stakeholders.
Q: Are there any data source limitations in either Databox or Google Data Studio?
Databox supports a wide range of data connectors and integrations, allowing users to connect to popular platforms and services. However, the availability of specific data sources depends on the integrations provided by Databox. It’s recommended to check the Databox documentation or reach out to their support team for the most up-to-date information on supported data sources.


