
Commercial vs Open-source Business Intelligence

In today’s data-driven business landscape, Business Intelligence (BI) tools play a crucial role in helping organizations analyze and interpret data to make informed decisions. One of the ongoing debates in the BI realm is the choice between commercial and open-source BI tools. This blog aims to provide an in-depth comparison of the 7 best tools, examining their features, pros, and cons, in both the commercial and open-source categories.
Commercial Business Intelligence Tools

Features
- Data Visualization: Powerful data visualization capabilities including charts, graphs, and interactive visual representations.
- Ad hoc Querying: Intuitive query builders and SQL-like interfaces for performing ad hoc queries on data and gaining real-time insights.
- Interactive Dashboards: Creation of dynamic dashboards that consolidate key metrics and visualizations in a single view. Customizable and real-time monitoring.
- Data Integration: Robust data integration capabilities, allowing connection and combination of data from multiple sources. Data cleansing and transformation.
- Advanced Analytics: Advanced analytics features such as predictive modelling, data mining, and statistical analysis for uncovering patterns and making data-driven decisions.
Pros and Cons
Commercial BI tools have several advantages. They provide comprehensive support, regular updates, and dedicated customer service. They also tend to have a polished user experience, extensive documentation, and robust security measures. However, commercial tools can be costly, and their customization options may be limited.
| Pros | Cons |
| Comprehensive Support: Vendors provide extensive support | Commercial BI tools often involve licensing fees and additional costs for support, maintenance, and upgrades. |
| Regular Updates: Tools receive regular updates and new features | Limited Customization: Customization options may be limited compared to open-source alternatives. |
| Dedicated Customer Service: Customer service teams are available for assistance | Vendor Dependency: Organizations are dependent on the vendor for ongoing support, updates, and product development. |
| Polished User Experience: Tools prioritize user-friendly interfaces | Learning Curve: Users may require training and familiarization with the tool. |
| Extensive Documentation: Vendors provide comprehensive documentation | Scalability: Some tools may have limitations when dealing with large volumes of data or complex analytics requirements. |
| Robust Security Measures: Tools prioritize data security |
Examples of Popular Commercial BI Tools

Tool 1: Tableau
Tableau is a renowned commercial BI tool designed to facilitate data visualization and business intelligence tasks. Its dynamic, visual approach to data analysis and reporting has garnered attention from businesses of various scales, making it a preferred choice for many who are keen on diving deep into their data to extract meaningful insights.
Features:
- Intuitive drag-and-drop interface: One of the standout features of Tableau is its user-friendly drag-and-drop interface, making data visualization a seamless task. This ensures that even individuals without a data background can intuitively design and develop charts, graphs, and reports by simply selecting and placing data fields onto the visual canvas.
- Data blending and real-time analysis: Tableau stands out for its ability to blend data from multiple sources, providing a holistic view of the data landscape. This means users can combine datasets, for instance, from an Excel sheet and a cloud-based CRM, into one cohesive dashboard. Furthermore, its real-time analysis capability ensures that users are always working with the most current data available.
- Compatibility with multiple data sources: The flexibility of Tableau extends to its compatibility with a plethora of data sources. From conventional SQL databases and Excel spreadsheets to modern cloud storage solutions and web applications, Tableau ensures data can be pulled from almost anywhere.
- Collaboration and sharing capabilities: Collaboration is at the core of most modern business processes. Recognizing this, Tableau offers features that allow users to share their dashboards and visual reports with team members. Not only can these be shared, but teams can also collaborate online, making joint data-driven decision-making possible.
- Robust mobile support: With the advent of mobile technology and the growing reliance on smartphones and tablets, Tableau offers a dedicated mobile app. The Tableau Mobile app ensures that users have access to their dashboards and reports on-the-go, making data-driven decisions possible even outside the confines of an office.
Pros:
- User-friendly interface: Tableau’s design philosophy centers on simplicity and ease of use, making it an excellent tool for individuals without a deep technical background.
- Highly customizable: Beyond basic visualizations, Tableau allows for in-depth customization of dashboards and reports, catering to specific business needs.
- Active community: Tableau has cultivated a vast and engaged user community. This translates to a wealth of shared resources, tutorials, guides, and forums for troubleshooting.
- Superior data visualizations: In the realm of data visualization, Tableau is often regarded as a leader, producing high-quality and aesthetically pleasing visual representations of data.
Cons:
- Cost: For smaller businesses or startups, Tableau’s pricing might be a hurdle. Investing in a commercial BI tool can be a significant decision, and for some, the cost might outweigh the benefits.
- Learning curve for advanced features: While Tableau is user-friendly at its core, delving into its more advanced features and capabilities can require time and effort to master.
- Performance issues: Like many BI tools, Tableau can sometimes struggle with performance, especially when dealing with extremely large datasets or complex visualizations. It’s crucial to ensure the underlying hardware and system specifications align with the demands of the data being processed.
Tool 2: Microsoft Power BI

Features
- Range of data visualization tools: Power BI provides an assortment of data visualization tools including charts, maps, and graphs.
- Integration with Excel and other Microsoft products: Import data from Excel seamlessly, and benefit from integration with the Microsoft ecosystem.
- Customizable dashboards: Create and customize dashboards with a variety of widgets.
- Natural language query through Q&A feature: Use natural language queries to quickly find answers in your data.
- Cloud-based and on-premises deployment: Choose between cloud-based or on-premises deployment.
Pros
- Seamless integration with Microsoft Office products.
- More affordable compared to some competitors.
- Strong mobile support.
- Continuous updates and feature additions.
Cons
- Some users find the interface less intuitive than competitors like Tableau.
- Fewer data source connectors.
- Can have performance issues with complex queries.
Best Open-Source BI Tools
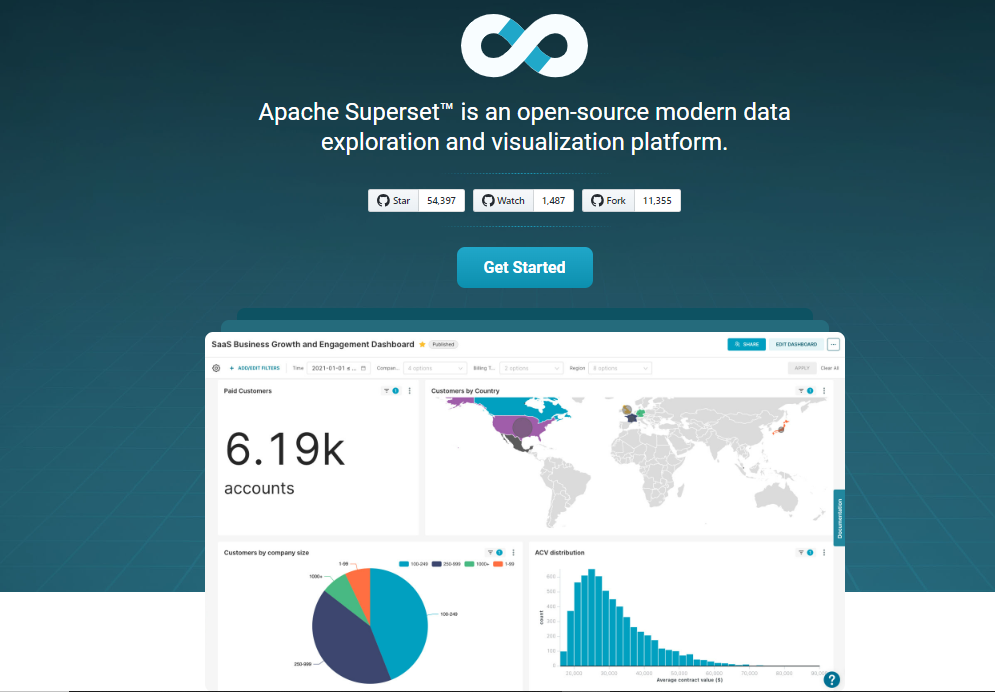
Tool 3: Apache Superset
Features
- Wide Range of Visualization Options: Superset’s visualization arsenal is vast. Users have a plethora of options ranging from basic charts and graphs to advanced mapping solutions. This ensures that data can be represented in a way that is most insightful, tailored to the nature and requirements of the dataset in question.
- SQL Editor for Custom Queries: Superset comes with an embedded SQL editor, allowing users to write and execute custom SQL queries directly from the interface. This feature appeals to those who want to probe data in a customized manner, beyond what standard visualizations might offer. The immediate feedback from custom queries allows for dynamic data analysis.
- Role-Based Access Controls: Managing who can see what is essential for data integrity and security. Superset’s role-based controls let admins assign varied access permissions to users based on their roles. This ensures that sensitive data is kept secure, and users only access and modify data that’s relevant to their roles, maintaining a streamlined workflow.
- Integration with Various Databases: One of Superset’s core strengths is its ability to integrate seamlessly with a myriad of SQL databases and cloud-based data storage solutions. Organizations often have data stored in various places, so this integration ability ensures that they can pull data from multiple sources without compatibility concerns.
Pros of Using Apache Superset
- High Customizability: Being open-source, Apache Superset allows businesses to tailor the tool according to their specific needs. This means adding new features, integrating unique plugins, or tweaking the existing functionalities becomes feasible.
- Active Community Maintenance: An active community backs Superset. This translates to regular updates, bug fixes, and the availability of a pool of expertise to consult when facing challenges.
- Efficient Data Handling: Superset is designed to manage large datasets without compromising on performance. For businesses with extensive data, this ensures smooth operations and quick visualizations.
Cons of Using Apache Superset
- Technical Expertise Requirement: While its customizability is a strength, it’s also a double-edged sword. To harness its full potential, a certain level of technical know-how is essential, which might not be suitable for all businesses.
- Less Polished Interface: Compared to some of its commercial counterparts, Superset’s user interface might feel less refined. This can impact the user experience, especially for those accustomed to more polished commercial tools.
- Limited Support and Documentation: Being open-source, Superset might not offer the same level of dedicated support or comprehensive documentation as commercial tools. Relying on community forums and resources might sometimes be the only recourse.
Tool 4: Metabase

Features
- Simple and intuitive user interface: Metabase features an easy-to-use interface that even non-technical users find accessible.
- SQL and non-SQL support: Query data using SQL or simpler visual methods.
- Customizable dashboards: Create custom dashboards that include various data visualizations.
- Slack integration: Send reports and alerts to Slack channels.
Pros
- Quick and easy setup.
- Supports a wide variety of charts and visualizations.
- Suitable for small to medium-sized datasets.
Cons
- May struggle with scalability for very large datasets.
- Less customizable compared to some alternatives.
- Limited customer support.
Tool 5: Jaspersoft

Jaspersoft is a widely recognized BI tool known for its robust reporting capabilities. Let’s delve deeper into its features, along with its pros and cons.
Features
- Reporting and Analysis: Jaspersoft provides a comprehensive suite of tools that allows users to design detailed reports. These reports can contain a multitude of elements like tables, charts, and other visual representations. The in-depth analysis can be performed with the data, allowing users to discern patterns, trends, and insights from the information presented.
- Dashboards and Data Visualization: With Jaspersoft, users can design dashboards that can host multiple data visualizations. These visualizations range from simple bar charts and line graphs to complex heat maps and scatter plots. The intuitive drag-and-drop interface helps in the easy creation and customization of these dashboards.
- Ad hoc Reporting: One of the standout features of Jaspersoft is its ad hoc reporting capability. Users can quickly create reports without needing extensive coding or scripting knowledge. This feature is particularly useful when there’s a need for quick insights or when dealing with dynamic data sets.
- Mobile BI: Jaspersoft’s Mobile BI feature allows users to access their reports and dashboards on-the-go through mobile devices. This feature ensures that business decisions can be made anytime, anywhere.
- Multitenancy Support: For businesses serving multiple clients or having distinct user bases, Jaspersoft offers multitenancy support. This means that a single Jaspersoft instance can cater to multiple clients or user groups, each with their dedicated environment and datasets.
Pros
- Wide Range of Reporting Features: Jaspersoft is comprehensive in its reporting capabilities, catering to a vast array of business needs.
- Scales with Large Datasets: Its robust back-end ensures that Jaspersoft handles large datasets effectively without compromising on performance.
- Integration with Other Systems: Jaspersoft can seamlessly integrate with various enterprise systems, making it a versatile tool in an organization’s tech stack.
Cons
- Steep Learning Curve: For those new to BI tools or Jaspersoft in particular, there might be a steep learning curve involved in mastering its extensive features.
- Outdated Interface: Some users might find the interface a bit dated, especially when compared to newer, more modern BI tools in the market.
- Cost of Commercial Version: While Jaspersoft does offer open-source versions, the commercial version, which comes with additional features and support, can be on the pricier side.
Tool 6: BIRT
BIRT is a renowned tool in the business intelligence ecosystem. When discussing BI tools, BIRT often finds itself at the centre of the debate between commercial and open-source platforms. Here’s a more comprehensive look at the features of BIRT, as well as its advantages and disadvantages:
Features
- Data Visualization: BIRT is designed to help users bring their data to life. With this tool, one can craft a wide array of visual representations including, but not limited to, various types of charts, graphs, and plots. These visualizations can make it easier to identify trends, patterns, and insights that might go unnoticed in raw datasets.
- Reporting and Analytics: Beyond mere visualization, BIRT excels in its robust reporting capabilities. Users can dive deep into their data, performing intricate analyses to extract actionable intelligence. Whether it’s running ad-hoc queries or setting up structured reports, BIRT offers a comprehensive suite of tools for data exploration.
- Cross Tables: For those dealing with multidimensional data, BIRT’s cross tables (or pivot tables) are indispensable. These tables allow users to dissect data from multiple angles, providing a nuanced understanding of complex datasets.
- Web Services APIs: One of BIRT’s standout features is its extensibility. Through its web services APIs, users can enhance and expand the tool’s core functionality. This allows for integration with other platforms, automation of tasks, and the development of custom features tailored to specific business needs.
- Extensive Library of Charts and Visualizations: BIRT offers a comprehensive library brimming with a variety of visualization options. Whether one needs a basic bar chart or a sophisticated heat map, BIRT likely has a suitable visualization to meet the requirement.
Pros
- High Customizability: BIRT is known for its flexibility. Thanks to its rich set of APIs, users can tailor the tool to their precise needs, ensuring that their BI platform aligns perfectly with their business goals.
- Diverse Visualization Library: With a wide array of charting and visualization options, users are never limited in how they represent their data. This range allows for creative and effective data presentations.
- Open Source with a Large Community: Being open-source, BIRT is not only free to use but also benefits from a large and active community. This community contributes to its development, provides support, shares best practices, and creates a wealth of resources for newcomers and experienced users alike.
Cons
- Steep Learning Curve: One of the challenges of using BIRT is its complexity. Newcomers might find it daunting to navigate and utilize the platform to its fullest potential initially.
- Performance with Large Datasets: While BIRT is powerful, it can sometimes falter when processing extremely large datasets, leading to slower response times and potential lags.
- User Interface: In comparison to some commercial alternatives, BIRT’s interface might not be as intuitive or user-friendly. This can contribute to the initial challenges faced by new users trying to familiarize themselves with the tool.
Tool 7: Knowage

Features
- Big data and traditional data sources support: Knowage is designed to integrate seamlessly with both big data platforms and traditional databases. This ensures that businesses can access and analyze a wide variety of data without any restrictions. It supports connections to platforms such as Hadoop, Spark, and many other big data ecosystems. On the traditional side, Knowage can connect to SQL databases, NoSQL databases, and even flat files.
- Advanced analytics and BI reporting: Knowage offers an array of analytical capabilities, allowing users to dive deep into their data. This includes tools for predictive analytics, what-if analysis, and more. Users can create interactive dashboards, BI reports, and multi-dimensional analysis. These reports can be shared, exported, and embedded into other applications.
- Location intelligence: With Knowage, businesses can harness the power of geospatial analysis. It allows users to overlay business data on maps, making it easier to spot trends, outliers, or areas of interest. It supports various map services and provides capabilities to create choropleth maps, heat maps, and more.
- Data/text mining: Data mining tools within Knowage aid businesses in extracting patterns, correlations, and insights from vast datasets. Text mining features help analyze unstructured text data, allowing for sentiment analysis, topic modeling, and more.
- Performance management and KPIs: Knowage enables businesses to set, monitor, and manage their Key Performance Indicators (KPIs). Users can define thresholds, set alerts, and visualize performance trends over time. This ensures businesses can keep track of their objectives and make timely decisions.
Pros
- Offers a broad set of analytical tools: Knowage provides a comprehensive suite of tools that cater to various analytical needs, making it suitable for different industries and use cases.
- Support for big data platforms: Its ability to connect with leading big data platforms ensures that businesses can tap into vast data sources without compatibility issues.
- Rich set of visualization options: From standard charts to advanced geospatial visualizations, Knowage offers a plethora of options for presenting data in an insightful manner.
Cons
- The setup process can be complex: Setting up Knowage, especially in a distributed environment or with specific integrations, can be a bit challenging, especially for those without a technical background.
- Limited documentation: Although Knowage is feature-rich, its documentation might not be exhaustive, making it difficult for users to troubleshoot issues or understand advanced features.
- May require extensive customization for specific use cases: While Knowage is versatile, some niche use cases might require extensive customization. This might involve additional development or integration work, which can be resource-intensive.
Exploring Open-Source Business Intelligence (BI) Tools

Definition and Features
Open-source Business Intelligence (BI) tools are software solutions that are developed and maintained by a global community of contributors. Unlike commercial BI tools, the source code of open-source tools is freely available to the public, allowing users to modify, customize, and distribute the software according to their specific needs.
Open-source BI tools offer a wide range of features and functionalities that are comparable to those found in commercial tools. These features include data analysis, data visualization, and reporting capabilities. Users can leverage these tools to extract insights from their data, create interactive visualizations, and generate comprehensive reports to support decision-making processes.
Pros and Cons
| Pros | Cons |
| Cost: Open-source BI tools are typically free to use | Technical Expertise: Using open-source tools may require more technical expertise compared to commercial tools. |
| Customization: Users can modify the source code to suit specific requirements | Support Options: Support options may vary depending on the community behind the tool. |
| Collaborative Community: Open-source tools benefit from a collaborative community environment | Learning Curve: Users may need to invest time and effort to familiarize themselves with the tool and its underlying technologies. |
| Flexibility: Open-source tools offer high customization potential |
Comparison of Commercial and Open-Source BI Tools
| Comparison Factors | Commercial BI Tools | Open-Source BI Tools |
| A. Cost | Involve licensing fees and additional costs for support and maintenance. | Generally free, although there may be costs associated with implementation and customization. |
| B. Customization and Flexibility | May have limitations on customization due to proprietary code. | Provide greater flexibility as users can modify the source code to suit specific needs. |
| C. Support and Documentation | Typically offer dedicated customer support, detailed documentation, and training resources. | Rely on community support, which can vary in responsiveness and availability of resources. |
| D. Scalability and Performance | Often designed to handle large-scale data processing and can offer optimized performance. | May require additional configuration and optimization for optimal scalability. |
| E. Community and User Base | Have well-established user communities and user bases, providing opportunities for networking and knowledge sharing. | Foster collaboration among developers and users within their respective communities. |
| F. Integration Capabilities | Often offer extensive integration capabilities with various data sources and third-party applications. | May require additional development effort for specific integrations. |
| G. Security and Data Privacy | Typically provide robust security features, including user authentication, access controls, and encryption. | Rely on community-driven security measures, with users responsible for implementing necessary security practices. |
Conclusion

Commercial and open-source BI tools each have their strengths and weaknesses. Commercial tools offer comprehensive support and polished user experiences but come with a price tag. Open-source tools provide cost-effective options and high customization potential but may require more technical expertise. When choosing between commercial and open-source BI tools, organizations should consider factors such as cost, customization, support, scalability, community, integration capabilities, and security.
When choosing between commercial and open-source BI tools, organizations should consider factors such as cost, customization, support, scalability, community, integration capabilities, and security. Navigating the intricacies of BI tools and making the right choice can be a challenge, but partnering with an expert can ease the process.
Ubique Digital Solutions is your ideal partner in this endeavour. With our industry knowledge and technical expertise, we can help you select and implement the BI tool that will catapult your business to success. Reach out to us today.
FAQs
Q: What is the main difference between commercial and open-source BI tools?
The main difference lies in their licensing models and development approaches. Commercial BI tools are proprietary and typically involve licensing fees, while open-source BI tools are community-driven and freely available.
Q: Are commercial BI tools always more expensive than open-source alternatives?
Yes, commercial BI tools often come with licensing fees and additional costs for support and maintenance, making them more expensive compared to open-source alternatives, which are typically free to use.
Q: Can open-source BI tools provide the same level of support as commercial tools?
Open-source BI tools rely on community support, which can vary in responsiveness and availability. Commercial tools generally offer dedicated customer support, detailed documentation, and training resources.
Q: Are open-source BI tools suitable for small businesses?
Open-source BI tools can be a good fit for small businesses with limited budgets, as they provide cost-effective options and high customization potential. However, technical expertise may be required for implementation and maintenance.
Q: Are commercial BI tools more secure than open-source tools?
Commercial BI tools often provide robust security features, including user authentication, access controls, and encryption. Open-source tools rely on community-driven security measures, requiring users to implement necessary security practices.
")

")


